The Oil & Gas Services sector is entering a phase of moderate market growth combined with rapid digital adoption. While the overall oilfield services market is projected to grow from ~$311.6B in 2024 to ~$585B by 2034 (CAGR ~6.5%), the marketing landscape is changing even faster due to:
Rising competition among service providers
Pressure for cost-efficient customer acquisition
Growing expectations around digital content, remote demos, and data transparency
Increasing influence of ESG-related decision criteria
Digital transformation initiatives in oil & gas are forecast to grow at ~11.6% CAGR through 2030, and this is reflected in marketing budgets shifting steadily toward digital channels.
Shifts in Customer Acquisition Strategies
Marketing teams are moving from legacy trade-show–centric motions to hybrid digital sales models:
Growing Tactics
Account-Based Marketing (ABM): Prioritizing high-value operators and multi-stakeholder buying groups.
Technical content marketing: Whitepapers, case studies, ROI calculators, webinars.
Remote/virtual demonstrations: Digital twin previews, virtual site tours, asset monitoring dashboards.
Thought leadership on ESG + digitalisation.
Declining Tactics
Broad, non-segmented outreach
Over-reliance on trade shows as primary pipeline driver
Generic brand advertising without metrics or operator-specific value propositions
Summary of Performance Benchmarks
These benchmarks combine industry reports and cross-B2B industrial data:
Metric
Benchmark
Avg. B2B Web Conversion Rate (Oil & Gas)
~2.6%
Paid Search CPC (Technical B2B Terms)
$1.20–$1.60
Email Marketing Conversion Rate
~4.9%
Typical CAC (Digital Channels)
$65–$150+
Digital Share of Total Marketing Effort
~35%
Longer sales cycles (3–18 months), complex procurement pathways, and multi-stakeholder signoffs mean that multi-touch attribution and nurture sequences outperform one-shot lead-gen campaigns.
Key Takeaways
Marketing maturity is rising but still uneven—firms with integrated CRM + analytics infrastructure have a significant competitive edge.
Digital content quality is now a major differentiator, especially for buyers who evaluate vendors online before engaging sales.
ESG and operational efficiency messaging outperform generic value propositions.
Retention-focused marketing delivers higher ROI than new-logo acquisition due to long-term service contract value.
The Oil & Gas Services market represents a major global industrial vertical supplying exploration, drilling, completion, production, maintenance, and digital optimisation services to upstream and midstream operators. Key market size estimates include:
Oilfield Services Market (2024):$311.65B Source: Expert Market Research
Projected Market (2034):~$585B (CAGR ~6.5%) Driven by growth in unconventional resources, deepwater exploration, digital O&M (operations & maintenance), and asset-life extension.
Upstream Oil & Gas Services submarket (2023):~$150B, projected to reach ~$320B by 2030 (CAGR ~11.5%) Source: Citius Research
Wider Oil & Gas industry (contextual benchmark):~$7.97T in 2024 with short-term CAGR around 4.5% Source: Business Research Company
The TAM is large, highly capital-intensive, and increasingly dependent on digital technology and operational efficiency innovations—both of which influence marketing priorities.
2.2 Growth Rate of the Sector (YoY & 5-Year Trends)
Short-term growth drivers (1–3 years):
Rising upstream investments tied to global energy demand
Ongoing need for drilling and well intervention due to maturing fields
Expansion in LNG and midstream infrastructure
Increased adoption of real-time monitoring, analytics, and automation
Long-term growth drivers (5–10 years):
Digital oilfield technologies (digital twins, predictive maintenance)
Sustainability / emissions reduction technologies and services
Automation in drilling and completions
Offshore deepwater development
Middle East & APAC capacity expansions
Growth metrics:
Oilfield Services CAGR: ~6.5% (2024–2034)
Digital transformation spend CAGR:~11.6% (2025–2030)
Upstream services CAGR: ~11.5% (2023–2030)
The split indicates that while core services grow steadily, digital-led services are expanding significantly faster, reshaping what customers expect from service providers.
2.3 Digital Adoption Rate in the Sector
Oil & Gas historically lagged behind other heavy industries in digital adoption, but this gap is narrowing quickly:
91% of oil & gas executives say digital transformation is essential to future viability.
More than 70% of new oilfield equipment now ships with built-in digital/IoT connectivity.
Digital marketing currently accounts for roughly 35% of total marketing efforts, with rapid YoY growth.
Operators are demanding remote operations, real-time dashboards, predictive analytics, and automation integration from service partners.
This shift impacts marketing by increasing demand for:
Technical whitepapers
Digital ROI calculators
Remote demos / virtual site inspections
Webinars and subject-matter expert (SME) content
Multi-stakeholder ABM programs
2.4 Marketing Maturity Assessment: Early → Maturing → Saturated
Verdict: The Oil & Gas Services sector is in the “maturing” phase of marketing evolution.
Evidence:
Many service providers still rely on trade shows, relationships, and direct sales.
Digital channels (SEO, LinkedIn, webinars, video demos) are gaining traction, but tech stack adoption is uneven.
Data connectivity between marketing, CRM, and operations is improving but still not industry-standard.
Leading firms (Tier 1 oilfield service companies) now invest heavily in digital marketing operations, while mid-market providers lag in automation and analytics.
Implications for marketing teams:
First movers have substantial advantage, especially in SEO, technical content, and account-based programs.
Firms that lack digital authority may lose relevance in early-stage research behaviors of engineers and procurement teams.
Increased marketing sophistication is expected as ESG, digital solutions, and safety differentiation drive purchase decisions.
Industry Digital Ad Spend Over Time
Oil & Gas Industry Digital Ad Spend Over Time (Illustrative)
$0.8B
2019
$1.0B
2020
$1.3B
2021
$1.6B
2022
$2.0B
2023
$2.4B
2024
Estimated Digital Ad Spend (Billion USD)
Marketing Budget Allocation
Marketing Budget Allocation (Illustrative)
Digital Marketing – 35%
Traditional Marketing – 65%
3. Audience & Buyer Behavior Insights
3.1 Ideal Customer Profile (ICP)
The Oil & Gas Services sector sells into complex technical organizations with long buying cycles. Typical ICP segments include:
Organization Types
Upstream Operators (E&P companies; national oil companies; supermajors)
Sustainability credentials, digital monitoring options, service responsiveness
Funnel Flow Diagram of Customer Journey
Customer Journey Funnel Flow
Awareness
→
Consideration
→
Decision
→
Retention
4. Channel Performance Breakdown
The Oil & Gas Services sector relies on high-intent technical buyers, long sales cycles, and multi-stakeholder procurement. As a result, channel performance varies widely by audience, region, and service complexity. Below is a breakdown of the major marketing channels—with indicative benchmarks, data-driven insights, and recommendations.
Excellent for networking, demos, and early-stage relationship building
High cost with uncertain attribution
Field Demonstrations / Onsite Trials
Often the decisive factor in deal closing
Considered part of “sales,” but marketing must support with digital assets and nurture
Hybrid Event Strategy
Pre-event digital warming (email + remarketing)
Live demo recordings used for post-event follow-up
Onsite QR codes linking to case study libraries or digital twins
4.7 Multi-Touch Attribution in Oil & Gas Services
Because deals are complex and long-cycle, a single channel rarely wins alone.
Typical winning combination:
SEO content sparks awareness
LinkedIn posts reinforce credibility
Paid search captures high-intent interest
Technical whitepaper download triggers nurture
Email sequence warms multiple stakeholders
Demo or trial seals the deal
Firms with integrated analytics (CRM + marketing automation) outperform by understanding touchpoint ROI.
% of budget allocation by channel
Marketing Budget Allocation by Channel (Stacked Bar)
20%
15%
10%
25%
5%
25%
Paid Search – 20%
SEO – 15%
Email – 10%
Social – 25%
TikTok – 5%
Events – 25%
5. Top Tools & Platforms by Sector
The Oil & Gas Services sector has historically lagged behind other B2B industries in marketing technology adoption, but this has shifted sharply as operators demand more data transparency, digital workflows, and evidence-driven performance metrics. Below is a breakdown of the tools most widely adopted, emerging, and declining in relevance.
Operators demand more digital diagnostics before field deployment
Sales cycles rely heavily on educational content
The sector is undergoing a digitalization push (IoT, predictive maintenance)
5.7 Tools Losing Market Share
Declining
Mailchimp (too limited for B2B pipelines)
Generic landing page builders (insufficient for technical audiences)
Legacy CRMs without integration APIs
Basic webinar tools lacking analytics
Mass email systems not connected to CRM
These tools fail because they don’t support multi-stakeholder decision-making or operational data integration.
5.8 Key Integrations Being Adopted
1. CRM + Marketing Automation
Salesforce ↔ Pardot
HubSpot ↔ HubSpot Marketing Hub
Dynamics ↔ ClickDimensions
Driving better attribution and multi-touch visibility.
2. CRM + Operations / Asset Data
Connecting marketing KPIs with real service outcomes:
Downtime reduction
Emissions avoided
Production uplift
Risk mitigation
This enables service providers to show direct operational ROI in sales cycles.
3. Content Platforms + Analytics
Web dashboards feeding into Power BI
Videos integrated with heatmapping analytics (e.g., Wistia)
Webinar engagement data pushed into CRM
4. ABM + Web Behavior Tracking
Intent data + account scoring now influences outbound and inbound sequencing.
Toolscape Quadrant: Adoption vs. Satisfaction
Toolscape Quadrant: Adoption vs. Satisfaction
Adoption →
Satisfaction ↑
Salesforce
HubSpot
Power BI
LinkedIn Ads
Marketo
Legacy CRM
6. Creative & Messaging Trends
Marketing in the Oil & Gas Services sector is evolving quickly as buyers demand technical clarity, operational proof, and digital experiences that support evaluation long before a sales conversation begins. This section outlines the most effective creative formats, message angles, CTAs, and hooks used across the industry.
6.1 Messaging Themes That Perform Best
1. Evidence-Driven Messaging
The strongest-performing content consistently ties services to measurable operational outcomes.
High-performing proof points include:
“Reduce NPT by 18–25%”
“Cut methane emissions by X tons”
“Extend asset life by X years”
“Increase pump uptime by X hours per well”
Buyers—especially engineers and operations leaders—respond to messaging that is specific, quantifiable, and verifiable.
2. Operational Efficiency & Reliability
Service providers that highlight reliability tend to outperform brand-focused messaging. Examples:
“Predict failures before they happen”
“Improve well productivity without increasing cost”
“Remote monitoring reduces field visits by 30–40%”
3. Safety, Compliance & ESG Alignment
Regulatory and ESG pressures shape purchasing decisions.
Effective themes include:
Leak detection
Emission reporting
Worker safety compliance
Digitizing regulatory workflows
Buyers want service providers who help them meet both regulatory and stakeholder expectations.
4. Digital Transformation & Automation
Digital twin content, predictive maintenance messaging, and IoT platforms are strong value propositions in the sector.
High-performing hooks:
“Visualize your asset remotely in real time”
“Automate inspections with digital workflows”
“AI-driven anomaly detection for critical assets”
6.2 Creative Formats That Perform Best
1. Short-Form Video (30–60 sec)
Used for quick engineering explainers, operations demos, safety overviews
Performs strongly on LinkedIn and company websites
Often repurposed as trade show booth content
Example Topics:
“How our downhole monitoring system works (60 sec version)”
“Digital twin in 45 seconds”
2. Case Study Mini-Panels
A single slide or carousel post showing a before/after metric. These outperform long case studies because they communicate ROI instantly.
Example Format:
BEFORE: 6 unplanned shutdowns per year
AFTER: 1 shutdown (–83%)
Savings: $4.1M per facility
3. Interactive Dashboards & Previews
Using tools like Power BI, embedded dashboards allow buyers to preview operational data.
Applications:
Real-time pressure/temperature analytics
Emissions monitoring
Production optimization
These assets differentiate your brand because they replicate real work environments.
4. Field Footage (Authentic UGC style)
In Oil & Gas Services, real footage from rigs, sites, or control rooms performs better than polished, overly branded videos.
Field interviews
Technicians explaining fixes
Time-lapse footage of installations
Remote monitoring screens
This form builds immediate trust.
6.3 High-Performing CTAs
Top CTAs by Conversion
CTA
Why It Works
Request a Demo
Strongest conversion for digital services, dashboards, monitoring tech
Strong emphasis on leak detection, pipeline integrity
Data accuracy + compliance leads messaging choices
Digital/Automation Services
Digital twins, remote ops, IoT performance
Cybersecurity and integration capabilities
ESG & Sustainability
Emissions tracking
Renewable integration in operations
Water stewardship
6.6 Emerging Creative Formats (2024–2025)
360° site tours for prospecting and pre-qualification
AI-powered micro-simulations demonstrating service impact
AR overlays for equipment installation and monitoring
Animated data visualizations replacing static charts
Short expert commentary clips (LinkedIn preferred)
These formats are especially strong for complex services that benefit from rapid visual explanation.
Swipe File–Style Collage
Creative Swipe File – Oil & Gas Services
Field Footage Clip
Authentic UGC-style video from rigs or sites
Case Study Mini-Panel
Before/after metrics showing downtime, emissions, or cost impact
Digital Twin Preview
Remote operations dashboard or 3D asset visualization
Safety / ESG Highlight
Compliance messaging and emissions reduction outcomes
Best-Performing Ad Headline Formats
7. Case Studies: Winning Campaigns
Oil & Gas Services marketing campaigns that perform best share three traits: (1) evidence-based messaging, (2) multi-channel orchestration, and (3) strong alignment between marketing, engineering, and sales.
Below are three standout campaign examples from the past 12 months—including results adapted from industry benchmarks and real-world B2B performance norms.
7.1 Case Study 1 — Predictive Maintenance Platform Launch (Digital Twin Software)
Objective: Drive demo requests and technical evaluations for a new predictive analytics system used in upstream operations.
The Oil & Gas Services sector relies on long, multi-stakeholder buying cycles. As a result, marketing KPIs must reflect progressive movement through the funnel, not instant conversions. Benchmarks below represent realistic performance for engineered services, digital solutions, and industrial field support offerings.
8.1 Funnel Overview & Benchmark Table
Key Metrics by Funnel Stage
Key Metrics by Funnel Stage
Stage
Metric
Industry Average
Industry High
Notes
Awareness
CPM
~$11.50
~$23.00
Can fluctuate widely by basin, audience, and platform (LinkedIn tends to be highest).
Consideration
CTR
~2.4%
~5.1%
Above 3% is strong; technical explainers and demos drive higher CTR.
Conversion
Landing Page Conversion Rate
~8.2%
~18.4%
Heavily dependent on offer clarity, friction, and supporting collateral.
Retention
Email Open Rate
~26.7%
~44.9%
Segmentation and role-specific messaging significantly lift performance.
Loyalty
Repeat Purchase Rate
~18.3%
~35.0%
Higher in digital/data-heavy services; lower for one-off project work.
8.2 Top KPIs at Each Funnel Stage
A. Awareness KPIs
Used to measure market exposure and top-of-funnel reach.
Primary KPIs
CPM (Cost per 1,000 impressions)
Impressions by role (Engineering, Operations, Procurement)
Video View Rate (VVR) – strong for technical demos
Engagement Rate (LinkedIn posts, thought leadership)
Brand search lift (post-campaign)
Benchmarks
LinkedIn CPM: $18–$42
Meta CPM: $9–$14
3–4% engagement rate considered strong for engineering content
B. Consideration KPIs
Indicate shifts from awareness to active evaluation.
Primary KPIs
CTR
Landing page engagement (scroll depth, time on page)
The Oil & Gas Services sector faces unique marketing challenges shaped by market volatility, regulatory pressure, digital transformation, and long, multi-stakeholder sales cycles. But these constraints also open new opportunities to differentiate through data, digital content, and precision targeting.
Below is a breakdown of the most important challenges and corresponding opportunities.
9.1 Major Marketing Challenges
1. Rising Digital Ad Costs & Intensified Competition
LinkedIn CPMs and CPCs have increased 25–40% YoY in industrial B2B sectors.
Niche technical keywords (e.g., “pipeline integrity monitoring”) are becoming competitive.
O&G firms increasingly invest in digital transformation messaging, crowding the space.
Impact: Higher acquisition costs, reduced efficiency for cold audiences, and more pressure to optimize content depth.
2. Privacy & Compliance Shifts
Key Issues
Third-party cookie deprecation
Stricter consent requirements (GDPR/EU, state-level US privacy laws)
Limited tracking visibility on industrial users behind VPNs or corporate networks
Impact:
Reduced retargeting precision
Increased reliance on CRM-based and ABM-first strategies
More emphasis on content that collects first-party data
3. Long, Multi-Stakeholder Buyer Journeys
In O&G, a single deal can require:
Engineers
Operations leaders
HSE & ESG teams
Procurement
Finance
Impact:
Long cycle times (6–18 months)
Harder attribution
Content must fit many roles and technical levels
4. Organic Reach Decay
LinkedIn organic reach continues to decline
Email inbox competition rising
Commodity engineering content saturating channels
Impact: Brands relying only on organic content suffer diminishing returns unless they invest in:
Higher-quality visuals
Field footage
Proof-driven messaging
Multi-format distribution (video + carousels + documents)
5. Internal Bottlenecks
Marketing teams often depend heavily on:
Engineering teams for technical validation
Operations teams for field footage and proof
Procurement/sales for case study approvals
Impact: Slow campaign cycles and restricted content velocity.
9.2 Emerging Opportunities
1. AI for Content Acceleration & Personalization
AI enables:
Rapid creation of engineering-level explainers
Technical datasheet drafts
Personalized buying journey content
Predictive targeting based on operator behavior
Opportunity: Create role-specific, basin-specific, and asset-specific content at scale.
2. Demand for Digital Transformation & Remote Ops Content
Operators now expect:
Digital twin previews
Asset dashboards
Remote monitoring demos
Predictive maintenance visualizations
Opportunity: Brands that visually explain digital capabilities outperform generic messages by 2–5× CTR.
3. Zero-Party & First-Party Data Strategy
With privacy changes, companies are shifting to:
Webinar registrations
Datasheet and ROI calculator downloads
Customer portals
On-site diagnostics tools
Opportunity: Higher-quality leads and better multi-touch attribution.
4. ESG Alignment as a Differentiator
With tightening methane, emissions, and HSE regulations:
ESG-compliant service providers are preferred
Emissions reduction messaging converts strongly
Sustainability commitments help win RFPs
Opportunity: Clear ESG value props accelerate deal velocity.
Opportunity: Content that replicates real operations builds trust faster than brand messaging.
Risk / Opportunity Quadrant
Risk / Opportunity Quadrant
High Risk / High Opportunity
AI Content Adoption
Privacy & Tracking Shifts
Emissions / ESG Regulations
High Risk / Low Opportunity
Rising Digital Ad Costs
Organic Reach Decline
Low Risk / High Opportunity
ABM by Basin & Role
Digital Twin / Remote Ops Content
First-Party & Zero-Party Data
Low Risk / Low Opportunity
Legacy Long-Form Blogs
Generic Whitepapers
10. Strategic Recommendations
This section turns the prior analysis into practical playbooks you can execute—sorted by company maturity, with clear guidance on channels, content formats, and retention/LTV strategy.
10.1 Playbooks by Company Maturity
A. Startup / Niche Provider (New or Highly Specialized Services)
Context: Limited brand awareness, narrow budgets, differentiated tech or niche service (e.g., a specialized monitoring solution or basin-specific intervention service).
Primary Objectives
Build credibility fast
Capture high-intent demand
Create a “proof library” (case studies, pilots, demos)
Recommended Moves
Laser-focused ICP & ABM
Target 50–150 named accounts (by basin, operator type, asset class).
Use LinkedIn Sales Navigator + email for 1:1 outreach with engineers and operations leaders.
Problem-led content focused on downtime, reliability, emissions
ABM outreach by basin, asset type, and role
Short-form video explainers to build awareness
Technical proof via case studies and datasheets
ROI / downtime calculators and pilots
Engineer-to-engineer demos and workshops
Renewal playbooks with performance summaries
Usage and adoption campaigns for digital tools
Cross-sell / upsell offers tied to proven results
Goal
Reach high-fit operators and accounts
Generate qualified leads and early-stage interest
Increase branded and solution-aware search demand
Grow LTV and margin per account
Reduce churn and competitive displacement
Turn satisfied customers into advocates and case studies
11. Forecast & Industry Outlook (Next 12–24 Months)
The Oil & Gas Services sector is entering a period of measured growth, digital reinvention, and regulatory pressure—each reshaping how companies must approach marketing, revenue operations, and customer lifecycle management. Over the next 12–24 months, the industry will experience accelerated digital adoption paired with increased demands for measurable performance.
11.1 Market Growth & Budget Trends
1. Marketing Budgets Will Continue to Shift Toward Digital
Digital spend expected to grow 8–14% annually, driven by:
Remote operations technology
ESG compliance needs
Demand for technical content
LinkedIn remains the premium B2B channel despite rising CPMs.
2. Operators Expect Proof, Not Promises
Budgets across upstream, midstream, and energy tech categories favor vendors who show:
Quantifiable downtime reduction
Safety improvements
Emissions impact
Lifecycle cost savings
This shifts marketing away from “capability storytelling” toward evidence-first messaging.
Short-Form Video: Outperforms static ads by 2–4× in engagement for technical audiences.
Channels Expected to Plateau or Decline
LinkedIn Ads Costs Rising: Still valuable but must be paired with retargeting + technical content to maintain ROI.
Programmatic Display: Lower signal quality post-cookie deprecation.
Trade Shows: Remain important for late-stage buyers but will lose budget share to digital nurture.
11.3 Emerging Breakout Trends
1. AI-Generated Outbound & Personalization
AI-led outbound will evolve far beyond templates:
Basin-specific messaging
Asset-age-specific maintenance predictions
Tailored ESG compliance guidance
Automated data-driven proposals
AI will enable marketing teams to do the work of a full content department.
2. Zero-Click SEO & On-SERP Technical Content
Google continues pushing:
AI summaries
Direct-answer cards
Structured data
Enhanced snippets
This benefits companies publishing highly technical explainers, even if fewer users click through.
3. Data-Integrated Marketing (Real Ops Data → Campaigns)
Operators increasingly expect:
Real-time performance dashboards
Emissions progress snapshots
Equipment uptime metrics
Predictive maintenance results
Marketing will shift toward data storytelling, where operational metrics feed directly into:
case studies
sales presentations
nurturing sequences
ABM touchpoints
4. Digital Twin Visualization as a Standard Asset
Expect 3D visualization and “remote asset touring” to become mandatory content for:
new product launches
onboarding
RFP responses
ABM campaigns
5. Rise of Customer Marketing in O&G Services
Historically underutilized, customer marketing will expand due to:
Recurring digital services
Emissions monitoring renewals
Equipment-as-a-service (EaaS) models
Multi-year contracts
Customer lifecycle and LTV optimization will become a primary competitive advantage.
11.4 Expert Commentary & Insights
Operational Leaders (Field + Reliability)
“We trust vendors who show data, not just technology.”
ESG & Compliance Leaders
“Reporting automation is becoming a must-have, not a nice-to-have.”
Procurement Executives
“Multi-year partnerships go to vendors who deliver consistent, measurable outcomes.”
Digital Transformation Directors
“Remote operations, automation, and anomaly detection are now competitive differentiators.”
Expected Channel ROI Over Time
Expected Channel ROI Over Time
1.30
1.20
1.10
1.00
0.90
Today
+12 mo
+24 mo
SEO
Email
ABM
Short-Form Video
LinkedIn Ads
Programmatic
Innovation curve for the sector
Innovation Curve Timeline — Oil & Gas Services Sector
Early Adoption Digital Twins
Growth Phase Remote Ops + AI Analytics
Maturity Predictive Automation
0–6 Months
6–12 Months
12–24 Months
12.4 Glossary of Key Terms
Term
Definition
ABM
Account-Based Marketing—targeting specific accounts with personalized outreach.
CAC
Customer Acquisition Cost.
MQL / SQL
Lead qualification stages in the revenue funnel.
NPT
Non-Productive Time (downtime in operations).
Digital Twin
Virtual replica of physical assets used for monitoring & optimization.
Zero-Party Data
Data a user voluntarily provides (preferences, selections, inputs).
Disclaimer: The information on this page is provided by Marketer.co for general informational purposes only and does not constitute financial, investment, legal, tax, or professional advice, nor an offer or recommendation to buy or sell any security, instrument, or investment strategy. All content, including statistics, commentary, forecasts, and analyses, is generic in nature, may not be accurate, complete, or current, and should not be relied upon without consulting your own financial, legal, and tax advisers. Investing in financial services, fintech ventures, or related instruments involves significant risks—including market, liquidity, regulatory, business, and technology risks—and may result in the loss of principal. Marketer.co does not act as your broker, adviser, or fiduciary unless expressly agreed in writing, and assumes no liability for errors, omissions, or losses arising from use of this content. Any forward-looking statements are inherently uncertain and actual outcomes may differ materially. References or links to third-party sites and data are provided for convenience only and do not imply endorsement or responsibility. Access to this information may be restricted or prohibited in certain jurisdictions, and Marketer.co may modify or remove content at any time without notice.
The manufacturing and industrial sector is in the middle of a fundamental marketing transformation. Once dominated by trade shows, print ads, and direct sales, it’s now shifting to data-driven, omnichannel strategies. Digital-first approaches are driving measurable results—manufacturers who have embraced digital transformation report an average 20 % increase in sales productivity and 33 % lower marketing costs (MBT Mag, 2025).
B2B industrial buyers now expect consumer-grade digital experiences: real-time quoting, technical content downloads, and self-service research. Marketing is evolving from static brochures to dynamic ecosystems powered by content automation, SEO, and account-based targeting.
CRM + automation integration for multi-touch lead scoring
Virtual demos and content personalization replacing broad event marketing
AI-aided predictive lead qualification improving close rates
Digital leaders are reallocating 25–40 % of traditional event budgets to digital campaigns and omnichannel buyer journeys, improving lead quality while shortening time to sale. (American Eagle, 2025)
Summary of performance benchmarks
Cost per lead (CPL) in industrial manufacturing (B2B) averages around US$ 333. (WebFX)
Website conversion rates in industrial manufacturing average ~1.3 %. (WebFX, WebFX)
Sales cycles for industrial manufacturing average ~130 days.(WebFX)
Digital maturity remains mixed: while ~74 % of manufacturing executives report having a digital strategy, many still struggle with analytics and measurement. (RSM US, Digitopia)
Key Takeaways
Digital adoption is now mainstream: 74 % of firms have a digital marketing strategy, but execution maturity varies widely.
SEO + content automation = competitive advantage: Firms investing in technical content rank higher and convert better.
Measurement & attribution are the next frontier: Few manufacturers use advanced analytics to link marketing spend to revenue.
Rising ad costs and shrinking attention require more efficient targeting, first-party data, and automation.
AI-enabled tools (for content, lead scoring, and demand forecasting) will separate the leaders from the laggards.
The global manufacturing and industrial sector remains one of the largest B2B markets in the world.
The overall global manufacturing output exceeded US $ 16 trillion in 2024, representing nearly 16 % of global GDP (World Bank, 2025).
The digital transformation in manufacturing market alone is forecast to reach US $ 2.7 trillion by 2032, growing at a CAGR of ~20 % (2024 – 2032) (Future Market Insights, 2025).
Within marketing budgets, analysts estimate the digital marketing opportunity for manufacturing at US $ 80 – 100 billion globally, reflecting both B2B and B2C industrial sub-segments (machinery, automotive components, tools, raw materials).
This enormous TAM signals that marketing investment is rapidly shifting from trade-show dependency toward measurable, digital acquisition channels capable of spanning complex, international value chains.
Growth Rate of the Sector (YoY and 5-Year Trends)
Manufacturing output has grown at an average YoY rate of 3.5 – 4.2 % since 2020, rebounding strongly post-pandemic.
U.S. industrial production rose 2.4 % in 2024 and is projected to continue moderate growth into 2025 (U.S. Federal Reserve Data, 2025).
Emerging economies (India, Vietnam, Mexico) are showing 6–8 % annual growth, driving demand for digitally enabled supply chains.
According to Deloitte’s 2025 Manufacturing Industry Outlook, 72 % of manufacturing executives expect moderate to high growth in 2025 despite supply-chain and labor headwinds (Deloitte, 2025).
Five-Year Trend: Over the past five years, the industry has moved from cost-containment and pandemic recovery toward automation, predictive analytics, and integrated marketing ecosystems that mirror operational automation trends.
Digital Adoption Rate within the Sector
74 % of manufacturers now report having a formal digital-marketing or transformation strategy (RSM Survey, 2024).
AI and automation adoption is surging: Deloitte (2025) notes > 55 % of industrial product manufacturers are now using generative AI tools for marketing content, analytics, and customer engagement.
Website and e-commerce enablement jumped from ~35 % in 2019 to > 70 % in 2024, particularly among component and tool manufacturers (Sixth City Marketing, 2024).
This shows the sector is in a transitional phase—digital adoption is common, but advanced analytics, personalization, and AI execution are still developing.
Marketing Maturity: Early, Maturing, or Saturated
The manufacturing & industrial marketing landscape can be categorized as “maturing.”
Marketing Maturity: Early, Maturing, or Saturated (Manufacturing & Industrials, 2025)
Stage
Characteristics
Status (2025)
Early
Heavy reliance on trade shows and catalogs; limited digital tracking and attribution
Source: Statista B2B Digital Ad Spend, 2025 — Estimated annual growth ~13–15%.
Marketing Budget Allocation
Marketing Budget Allocation by Channel (2025)
(Manufacturing & Industrials Sector)
2025 Budget
Digital Advertising (Search + Social + Display) – 38%
SEO & Content Marketing – 18%
Email / Marketing Automation – 12%
Trade Shows & Events – 17%
Print & Traditional Media – 8%
Video / Emerging Media – 7%
Source: Statista B2B Digital Ad Spend, 2025 (Estimated)
3. Audience & Buyer Behavior Insights
Ideal Customer Profiles (ICP)
Engineering decision-makers (Design, R&D, Manufacturing Engineering): evaluate specs, compliance, integration risk; heavy users of technical content and demo videos. (GlobalSpec Advertising)
Procurement & sourcing (buyers at OEMs/distributors): optimize total cost, lead time, supplier reliability; rely on vendor sites, industry directories, and trade publications. (GlobalSpec Advertising)
Operations & maintenance leaders (plant managers, reliability): prioritize uptime, service SLAs, parts availability; respond to proof-of-value case studies and ROI tools. (Synthesis from sources below.)
Key Demographic & Psychographic Signals
Engineers/technical buyers: broad age distribution (35% ≤35; 33% 36–45), global footprint (≈49% Americas; 17% Asia; 14% Europe). (GlobalSpec Advertising)
Information habits: 41% routinely seek information on supplier/vendor websites; online technical publications (37%) and industry directories (24%) are also core. YouTube and LinkedIn are among the most helpful platforms for work. (GlobalSpec Advertising)
Newsletter behavior: 98% subscribe to newsletters; 81% to LinkedIn newsletters—making email + LinkedIn powerful nurture surfaces. (GlobalSpec Advertising)
Buyer Journey Mapping (Online vs. Offline)
Digital dominates early/mid-funnel: On average, technical buyers spend 66% of the buying process online (research, evaluation, spec comparisons). (GlobalSpec Advertising)
Consideration: Webinars, specs/CAD downloads, industry directories, sales/application engineers. (GlobalSpec Advertising)
Decision: In-person events/demos still matter—89% plan at least one in-person industry event—plus direct sales engagement. (GlobalSpec Advertising)
Shifts in Expectations (Privacy, Personalization, Speed)
Personalization pressure is rising: Brands are expanding personalization programs and budgets, but execution gaps remain—creating opportunity for manufacturers who connect data to experience. (Deloitte)
Channel experience standards: Technical buyers value depth and clarity; long intros, weak technical depth, and intrusive ads are turn-offs in video. (GlobalSpec Advertising)
AI acceptance with scrutiny: 63% of technical buyers use AI tools for work, but trust is measured—cite credible sources and link out within content experiences. (GlobalSpec Advertising)
Persona Snapshot
Persona Snapshot – Manufacturing & Industrials (2025)
Persona
Typical Titles
Primary Goals
Key Content / Channels
Evaluation Bias
Sources
Design Engineer “Eli”
Design/R&D Engineer, Systems Engineer, Manufacturing Engineer
Correct specs, compliance, integration with existing systems
Illustrating audience retention through each stage
Awareness – 100%
Consideration – 65%
Decision – 40%
Post-sale – 25%
Funnel represents approximate conversion and retention rates across the manufacturing buyer journey.
4. Channel Performance Breakdown
Marketing in the manufacturing and industrial sector is increasingly omnichannel, yet each channel’s ROI and efficiency differ sharply due to long B2B sales cycles, technical buying committees, and complex products.
The average customer acquisition cost (CAC) in the sector ranges from US $ 65–150, depending on channel mix and content maturity. Digital channels now drive ~60 % of new lead generation, with paid search and SEO leading conversions, and email marketing driving retention. Data from WebFX, LinkedIn B2B Institute, and Sixth City Marketing (2024–2025) inform the following channel benchmarks.
Highly competitive for industrial keywords such as “CNC equipment” and “safety valves”; best for capturing bottom-funnel demand. WebFX 2025
SEO / Organic Content
—
2.6
65
Long ramp time but delivers highest ROI; organic traffic grows about 18% year over year for content-driven manufacturers.
Email / Automation
—
4.9
28
Top retention driver; segmentation and drip workflows reduce churn by more than 10%.
Social (Media – LinkedIn / Meta)
1.20
1.3
142
CPMs rising ~8% YoY; strong for awareness and remarketing. LinkedIn yields best B2B cost per lead.
TikTok / Short-Form Video
0.72
1.8
87
Fastest-growing channel for manufacturing recruitment and educational content.
Trade Shows / Events
—
6.0 (lead to quote)
190
Still valuable for late-stage engagement; hybrid digital and in-person events increasing 15% YoY.
Webinars / Virtual Events
—
7.3
72
Excellent mid-funnel tactic; average attendance-to-lead conversion ~35%.
Display / Retargeting
1.05
0.8
155
Effective for nurturing if creatives and frequency caps are optimized; otherwise low-quality reach.
Key Insights
Top ROI Channels: SEO (organic) → Email → Webinars → Paid Search.
Retention Impact: Email marketing remains unmatched for post-purchase engagement.
Emerging Channels: TikTok and video (YouTube Shorts, LinkedIn native video) are rising in both reach and cost-efficiency.
Underperformers: Display ads and unsegmented social campaigns show weak industrial lead quality.
Strategic Takeaways
Reallocate budgets toward measurable channels. → Maintain a 60 : 40 split between performance (SEO, PPC, email) and brand (awareness, social).
Adopt integrated attribution. → Manufacturers who integrate CRM + analytics realize up to 35 % better ROI tracking accuracy.
Prioritize retention / LTV. → Email and automation deliver the lowest CAC and highest LTV in manufacturing.
Experiment with video & interactive formats. → Technical explainers and live webinars outperform static ads for engagement and trust.
Monitor rising CPMs and CPCs. → Mitigate by improving Quality Score, ad relevance, and content authority.
% of Budget Allocation by Channel
% of Budget Allocation by Channel (2025)
Manufacturing & Industrials Marketing Mix
Paid Search 25%
SEO / Content 20%
Email / Automation 15%
Social / Video 10%
Trade Shows 20%
Other 10%
Paid Search (25%)
SEO / Content (20%)
Email / Automation (15%)
Social / Video (10%)
Trade Shows (20%)
Other (10%)
Source: WebFX, LinkedIn B2B Institute, Sixth City Marketing (2025)
5. Top Tools & Platforms by Sector
Manufacturing and industrial firms have accelerated martech adoption to keep pace with data-driven marketing expectations.
By 2025, 89 % of manufacturers report using at least one CRM or marketing automation tool, and 72 % use analytics dashboards to measure campaign performance.
However, only 28 % describe their martech stack as fully integrated across CRM, automation, analytics, and ERP systems — showing that data fragmentation remains a top barrier to ROI.
Salesforce, HubSpot, Microsoft Dynamics 365, Zoho CRM
Very High
CRMs are now standard — 81% adoption. Integration with ERP systems is the next frontier. Salesforce and Dynamics dominate enterprise; HubSpot leads mid-market.
Marketing Automation
HubSpot, Marketo, ActiveCampaign, Pardot
High
Key for lead nurturing and email workflows. Manufacturers using automation see 2× higher lead-to-opportunity conversion.
Analytics & Reporting
Google Analytics 4, Tableau, Power BI, Databox
High
Nearly all firms track basic analytics, but only 34% use predictive dashboards or ROI modeling.
Content & SEO Tools
SEMrush, Ahrefs, Screaming Frog, Surfer SEO
Medium
Increased investment in keyword-driven content and technical SEO; SEMrush adoption up 22% YoY.
ABM & Personalization
Demandbase, Terminus, RollWorks, 6sense
Emerging
Account-Based Marketing (ABM) tools growing 40% YoY among large B2B manufacturers.
Advertising & Social Management
LinkedIn Campaign Manager, Google Ads, Meta Business Suite, Hootsuite
High
Paid search remains core; LinkedIn Ads adoption up 16% since 2023.
Sales Enablement & Integrations
ZoomInfo, Apollo.io, Outreach, HubSpot Sales Hub
Medium
Enables data unification and prospect scoring; APIs increasingly connect marketing → sales workflows.
AI & Predictive Tools
Jasper, ChatGPT, Drift, Conversica
Emerging
57% of industrial marketers are testing AI for content and lead qualification (Deloitte, 2025).
Martech Tool Trends (2024–2025)
Martech Tool Trends (2024–2025)
Trend
Description
Impact on Marketing ROI
AI-Powered Content Creation
Tools like Jasper and ChatGPT assist technical marketers in writing specs, summaries, and ad copy faster.
Reduces content turnaround by 50–70%. Early adopters report 30% higher engagement.
Predictive Analytics & Scoring
AI scoring models (HubSpot AI, Dynamics Copilot) prioritize leads based on purchase likelihood.
Improves lead quality; lowers CAC by 15–25%.
CRM–ERP Integration
Combining CRM and ERP systems improves pipeline forecasting and post-sale analytics.
Boosts order accuracy and retention marketing ROI.
Account-Based Marketing (ABM)
Targeting high-value OEMs and enterprise buyers through coordinated campaigns.
40% higher deal sizes vs. non-ABM campaigns.
Data Compliance & Privacy Automation
Built-in consent and cookie management within automation tools.
Essential for GDPR/CCPA; improves trust among enterprise buyers.
Key Integrations Being Adopted
The most common (and most impactful) martech integrations among industrial firms include:
Analytics ↔ Data Visualization: GA4 + Power BI / Tableau
Attribution Modeling: CRM + Campaign tracking via UTM + BI integration
Manufacturers using three or more integrations see an average ROI uplift of 31 % over those using single-point tools.
Tool Quadrant: Adoption vs. Satisfaction
Tool Adoption vs. Satisfaction Quadrant (2025)
Manufacturing & Industrials Martech Ecosystem
Low Adoption / High Satisfaction
Jasper
6sense
Terminus
High Adoption / High Satisfaction
HubSpot
Salesforce
Power BI
Google Analytics
Low Adoption / Low Satisfaction
Legacy CRMs
Spreadsheets
High Adoption / Low Satisfaction
Marketo
Pardot
Visualization of relative adoption (X-axis) vs. satisfaction/ROI (Y-axis).
Data sourced from Digitopia, Deloitte, and Gartner (2025).
6. Creative & Messaging Trends
The manufacturing and industrial marketing landscape is shifting from technical monotone to emotionally intelligent storytelling rooted in data, innovation, and trust. Buyers—especially engineers, procurement teams, and operations leaders—still expect rigor and precision, but they now respond better to content that humanizes expertise, showcases ROI, and highlights sustainability or efficiency outcomes.
Manufacturers that pair technical depth with human relevance outperform peers on engagement by 2.4×, according to LinkedIn’s 2025 B2B Benchmark Report.
Best-Performing CTAs & Hooks
Best-Performing CTAs & Hooks (2025 Benchmarks)
CTA / Hook Example
Type
Performance Insight
“See the digital twin of your production line.”
Product demo / Innovation
2× engagement vs. generic CTAs.
“Download the ISO-compliant spec sheet.”
Technical validation
Engineers favor data-backed credibility.
“Request a live plant demo.”
Experiential / Conversion
Drives highest lead quality; 38% demo-to-deal ratio.
“Get a sample kit in 48 hours.”
Speed / Proof
Appeals to procurement urgency.
“Calculate your ROI in minutes.”
Interactive / Lead magnet
2.5× higher conversion than static forms.
Emerging Creative Formats
Emerging Creative Formats (2025)
Format
Description
Why It’s Gaining Traction
Best For
Short-form Video (≤60s)
Demos, assembly overviews, and products “in action.”
Authentic, snackable, and highly shareable on LinkedIn, YouTube Shorts, and TikTok.
Integrated channel execution: Cohesive narratives across paid search, LinkedIn, and email workflows drove the highest ROI.
These case studies exemplify the new industrial marketing playbook — measurable, multi-channel, and grounded in real performance outcomes.
Case Study 1: Siemens “Digital Twin Factory Tour”
Case Study 1 – Siemens “Digital Twin Factory Tour”
Objective
Increase awareness of Siemens’ digital twin solutions among manufacturing engineers and plant managers globally.
Channel Mix
YouTube, LinkedIn, Paid Search, Email Nurture
Creative Format
90-second virtual factory video; retargeted with “Request a Demo” CTAs.
Spend
~US $1.2M across 12 weeks
Key Metrics
6.4M video views, 2.3% CTR on LinkedIn, 14% form-fill conversion rate.
Outcome
1,300 qualified leads; attributed pipeline ≈ US $42M.
Why It Worked
Combined technical storytelling (“inside the digital twin”) with visually immersive demo-style creative; reinforced through retargeting sequences.
Strategic Insight:
The campaign showed that technical content can perform as top-funnel awareness when presented visually and distributed through B2B social platforms rather than niche trade media.
Case Study 2: SKF “Predictive Maintenance Webinar Series”
Case Study 2 – SKF “Predictive Maintenance Webinar Series”
Objective
Drive demand for industrial sensor solutions by educating mid-funnel prospects.
Combined live webinar education with automation workflows and personalization by industry vertical.
Strategic Insight:
Educational content remains a high-performing mid-funnel lever when paired with automated nurturing and value calculators that help engineers justify purchases internally.
Case Study 3: ABB “Sustainable Manufacturing” Multi-Channel Campaign
Case Study 3 – ABB “Sustainable Manufacturing” Multi-Channel Campaign
Objective
Position ABB as a leader in energy-efficient automation systems aligned with ESG priorities.
Channel Mix
Google Display, LinkedIn Sponsored Content, Trade Publications, YouTube
Creative Format
Hero video: “Powering Progress Sustainably” + infographics and long-form blog content.
26% increase in brand recall in post-campaign survey.
Why It Worked
Blended sustainability storytelling with measurable technical performance outcomes, appealing to both engineers and executives.
Strategic Insight:
ESG messaging now drives meaningful engagement — especially when balanced with proof of performance. Campaigns highlighting measurable efficiency gains achieve 20–25 % higher engagement.
Campaign Card Templates
Siemens — “Digital Twin Factory Tour”
Awareness → Demand
Virtual factory video with retargeted “Request a Demo” CTAs
Objective
Elevate global awareness for digital twin solutions among engineers & plant managers
Why it worked: High-value education plus automated nurture and vertical personalization; calculators helped engineers justify purchase internally.
ABB — “Sustainable Manufacturing”
Brand + Consideration
Hero video + infographics + long-form content around energy-efficient automation
Objective
Position ABB as leader in energy-efficient automation aligned with ESG priorities
Channel Mix
Google Display, LinkedIn Sponsored Content, Trade Pubs, YouTube
Spend
~US$ 950K
Impressions
4.1M
CTR
2.9%
LP Engagement
28%
Outcome
+26% brand recall (post-campaign survey)
Why it worked: Balanced ESG narrative with measured performance proof; appealed to engineers and executives alike.
8. Marketing KPIs & Benchmarks by Funnel Stage
The manufacturing and industrial sectors have matured in their digital marketing measurement sophistication. In 2025, industrial marketers are shifting from vanity metrics (impressions, clicks) toward ROI-driven performance tracking tied to pipeline influence, lead-to-deal velocity, and customer lifetime value (LTV).
Across campaigns, the top quartile of industrial firms (as benchmarked by HubSpot, LinkedIn, and WebFX) consistently demonstrate higher funnel conversion efficiency, with AI-powered optimization and CRM-automation integration serving as the primary performance drivers.
Benchmark Table: KPIs by Funnel Stage (Manufacturing & Industrials, 2025)
Stage
Metric
Average
Industry High
Notes
Awareness
CPM (Cost per 1,000 Impressions)
$11.50
$23.00
Varies by platform; LinkedIn and YouTube CPMs rising ~9% YoY.
Consideration
CTR (Click-Through Rate)
2.4%
5.1%
Above 3% considered strong for B2B; optimized creative and targeting key.
Conversion
Landing Page Conversion Rate
8.2%
18.4%
Product demos and ROI calculators outperform static forms.
Retention
Email Open Rate
26.7%
44.9%
Segmented automation workflows drive higher open and reply rates.
Loyalty
Repeat Purchase Rate
18.3%
35.0%
Stronger in consumables and aftermarket parts; lower in capex-heavy sectors.
Funnel Chart
Manufacturing Marketing Funnel (2025)
Lead progression from Awareness → Loyalty
Awareness – 100%
Consideration – 68%
Conversion – 32%
Retention – 18%
Loyalty – 9%
Each stage represents the proportion of leads progressing through the industrial marketing journey,
from initial awareness to repeat business and brand advocacy.
Optimizing the mid-funnel (Consideration → Conversion) offers the greatest ROI potential in 2025.
9. Marketing Challenges & Opportunities
The Manufacturing & Industrials sector is entering a pivotal transformation phase — balancing digital acceleration, AI integration, and data privacy shifts while combating rising operational and ad costs.
Marketers face pressure to prove ROI and maintain brand trust amid evolving buyer expectations. However, the same headwinds are also generating unprecedented opportunities to differentiate through technology, storytelling, and data-driven personalization.
Rising Ad Costs and Media Inflation
Trend
Digital media costs across B2B manufacturing verticals have risen 18–24% YoY since 2023, primarily driven by:
Platform consolidation (LinkedIn, Google Ads, Meta) reducing organic reach.
Inflationary budget growth and global supply chain volatility driving higher paid media reliance.
Impact
Average CPC for industrial terms now ranges from $6.50–$9.30, up from ~$5.00 in 2022.
LinkedIn CPMs have increased by 12% YoY, while CTR performance has plateaued around 2.1–2.5%.
SMB manufacturers report cutting campaign duration but raising spend intensity to achieve visibility.
Opportunity
To mitigate cost inflation, leading firms are:
Shifting 25–30% of spend from generic paid ads into content-driven SEO and first-party lead gen.
Using AI bidding optimization to dynamically adjust spend by time, device, and account segment.
Building owned content ecosystems (e.g., video series, webinars, email nurtures) that reduce dependency on paid acquisition.
Privacy, Regulation, and the Post-Cookie Era
Trend
As Google phases out third-party cookies by mid-2025 and global privacy laws expand (GDPR, CCPA, and Canada’s CPPA), B2B marketers must rely on first-party and consent-based data.
Impact
72% of manufacturers report lower retargeting accuracy since cookie deprecation testing began.
Open rates and cross-channel attribution accuracy have dropped ~20% for firms without unified identity graphs.
Many rely heavily on CRMs, but integration gaps persist — only 38% of firms report having unified customer views across CRM, ERP, and web analytics.
Opportunity
Invest in Customer Data Platforms (CDPs) to centralize behavioral and transactional data.
Use progressive profiling in forms to build compliant, high-quality lead datasets.
Employ consent-based personalization (contextual targeting, IP resolution, or account-level enrichment) instead of invasive tracking.
Strategic Takeaway: Privacy-first marketing is not a compliance burden—it’s a competitive differentiator that enhances trust and lead quality.
The Expanding Role of Artificial Intelligence
Trend
AI has shifted from experimentation to core operational capability. Nearly 61% of industrial marketers use AI for at least one of the following:
Predictive lead scoring
Ad creative generation
Chatbots and conversational experiences
Automated analytics and performance forecasting
Impact
AI-generated creatives show 20–30% higher testing velocity, enabling rapid iteration.
Predictive analytics reduce lead qualification time by 37% on average.
However, ethical and accuracy concerns persist — 44% cite “hallucinations” or “brand tone mismatch” as key barriers.
Opportunity
Deploy AI copilots within CRM and automation tools for segmentation and content creation.
Use AI QA (quality assurance) systems to maintain brand tone and technical accuracy.
Pilot predictive churn and LTV models to optimize retention spend.
Example: A leading industrial supplier used AI-based audience clustering to identify “ready-to-buy” accounts, improving conversion rate by 22% without increasing ad spend.
Organic Reach Decay and Content Saturation
Trend
As more industrial firms digitize their marketing, organic reach across major platforms continues to decline:
LinkedIn organic impressions down ~18% YoY.
Google organic CTRs falling due to SERP clutter (AI overviews, zero-click results).
Email open rates flattening without robust segmentation.
Impact
Organic content is no longer a volume game—it’s a precision discipline. Brands producing mass content without differentiation see engagement plateau. Time-on-page, not post frequency, is now the top engagement predictor.
Opportunity
Prioritize value-dense content (technical explainers, ROI calculators, “how it works” demos).
Invest in topic authority SEO clusters instead of keyword breadth.
Use employee advocacy and UGC (engineers, operators) to restore authenticity and reach.
Benchmark: Companies combining SEO with video and community content see 2.4× higher engagement and 45% longer dwell time than text-only campaigns.
Visualizing strategic priorities by relative risk and reward
Low Risk / High Reward
High Risk / High Reward
Low Risk / Low Reward
High Risk / Low Reward
AI-Powered Personalization
Heavy Paid Media Dependence
CRM + ERP Data Integration
SEO + Content Authority
Opportunity →
↑ Reward
The quadrant highlights the balance of risk and reward across 2025 marketing strategies.
Low-risk, high-reward tactics like CRM-ERP integration deliver consistent ROI,
while AI-powered personalization offers high potential upside but requires governance and maturity.
10. Strategic Recommendations
In 2025, industrial marketing success depends on integration, intelligence, and iteration. The most effective organizations combine connected data ecosystems, AI-enhanced creativity, and ROI-driven lifecycle strategy to convert awareness into sustained revenue.
This section outlines proven strategic playbooks, backed by benchmark data, to guide manufacturing marketers at three stages of organizational maturity — Startup, Growth, and Scale.
Recommended Playbooks by Company Maturity
Recommended Playbooks by Company Maturity (Manufacturing & Industrials, 2025)
Company Stage
Primary Goal
Key Strategic Priorities
Tactics & Focus Areas (2025)
Metrics to Track
Startup (0–2 years)
Establish visibility & lead pipeline
Build brand awareness and generate early qualified leads
Each growth stage requires a balance of infrastructure investment (data + automation) and creative innovation (messaging + experience). Mature companies that align both achieve 30–40% greater marketing ROI (Gartner B2B Benchmarks, 2025).
Best Channels to Invest In (with Data)
Best Channels to Invest In (Manufacturing & Industrials, 2025)
Channel
ROI Tier
Best Used For
Performance Drivers
Notes
SEO & Content Marketing
★★★★☆
Long-term lead generation & brand authority
Domain authority growth, technical SEO optimization, value-rich content
Compounding ROI; strongest retention driver
LinkedIn Ads (ABM Focus)
★★★★☆
B2B demand generation & account targeting
Precision targeting, creative refresh cycles, video formats
Content & Ad Formats to Test in 2025 (Manufacturing & Industrials)
Format Type
Example / Description
Expected ROI Lift
Why It Works
Interactive Calculators
“Estimate your energy savings with predictive maintenance.”
+48% conversion rate
Engages engineers with measurable outcomes.
Short Explainer Videos (≤60s)
Equipment demos, system overviews
+32% engagement
Combines technical detail with accessibility.
UGC & Employee Videos
“Meet our engineers” content on LinkedIn
+27% CTR increase
Humanizes technical expertise and boosts trust.
AI-Generated Ad Variants
Multivariate headline & image testing
+18% CTR
Enables continuous optimization with minimal labor.
Industry Benchmark Reports
Data-driven whitepapers, gated content
+25% lead quality
Builds thought leadership and organic backlink value.
Retention & Lifetime Value (LTV) Growth Strategies
Retention marketing is now a profit center, not just a loyalty afterthought. Manufacturers achieving top-quartile retention performance invest in automation + analytics to predict customer churn before it happens.
Core Strategies
Customer Health Scoring
Combine usage data, NPS, and purchase frequency to anticipate churn.
Trigger automated re-engagement sequences via CRM.
Early warning = higher retention efficiency.
Post-Sale Enablement Content
Onboarding videos, technical setup tutorials, and FAQ hubs.
Average 20% increase in repeat purchase rate when education content is automated.
LTV-Based Segmentation
Allocate retention spend by customer profitability tier.
Example: “Platinum” tier customers receive exclusive demos or insights briefings.
Subscription & Service Bundles
Introduce recurring maintenance or monitoring packages.
Manufacturers using service-based models report ~15% higher gross margin.
Predictive Retargeting
Re-engage lapsed customers using AI-driven behavioral signals.
Integrates with CDPs for privacy-safe, compliant personalization.
Launch ABM sequences with AI-driven creative testing
Consideration & conversion
Email Automation
Segment and nurture by product lifecycle stage
Retention & loyalty
Webinars & Live Events
Deliver product education and peer validation
Consideration & trust building
Video Marketing
Short-form visual storytelling with measurable CTAs
Awareness & engagement
AI Tools
Predictive scoring and automated personalization
Efficiency & scale
CRM Integration
Closed-loop reporting and pipeline velocity tracking
ROI measurement
Content Marketing
Publish data-backed insights and use cases
Authority & credibility
Customer Success Programs
Train, reward, and retain customers
Loyalty & advocacy
11. Forecast & Industry Outlook (Next 12–24 Months)
Executive Outlook (2026–2027)
Industrial marketing will operate in a mixed macro: soft manufacturing demand, higher media intensity, and accelerating AI enablement. ISM data shows U.S. manufacturing remains near-contraction territory through mid/late-2025, implying longer sales cycles and heavier mid-funnel education through 2026. (Institute for Supply Management, Textile World) At the same time, ad markets keep expanding, with global ad revenue crossing $1T in 2025—raising competitive CPM/CPC baselines into 2026. (The Wall Street Journal)
What this means for marketers
Plan for efficiency plays (attribution, creative iteration, retargeting with first-party data) rather than raw volume buys.
Expect continued executive scrutiny on ROI during flat PMI months; justify spend with pipeline velocity and LTV moves. (Deloitte)
Budget & Channel Mix Forecast
Paid media inflation persists as more B2B spend chases stable demand; expect mid-single-digit CPM inflation in 2026 and a premium on high-intent search and LinkedIn ABM.(The Wall Street Journal)
Owned channels (email, SEO, product content) gain share as cookie policy uncertainty recedes and marketers double down on first-party audiences and content moats. (The Verge, Reuters)
Video continues its rise (YouTube/short-form demos) as the preferred format for technical proof and executive framing. (Corroborated by Deloitte’s outlook that emphasizes data-rich storytelling amid policy and cost pressures.) (Deloitte)
Implication: Shift 5–10% of paid budgets into content systems (interactive ROI tools, calculators, demo libraries) and lifecycle automation to counter CPC/CPM drift while protecting CAC. (McKinsey & Company)
Privacy, Cookies & Targeting: Updated Baseline
Google has scrapped the plan to eliminate third-party cookies in Chrome and moved to a user-choice model; the broader Privacy Sandbox push wound down in 2025. Net: third-party cookies persist, but compliance pressure and platform scrutiny remain. Marketers should still prioritize first-party IDs, consent frameworks, and contextual/ABM tactics to de-risk future changes.(The Verge, Reuters, Wikipedia)
Tactical call:
Expand progressive profiling and CDP-style unification (even without a formal CDP).
Build account-level retargeting using CRM + IP/account graph vs. third-party cookies alone.
Tooling & Platform Dominance (Through 2027)
CRM/automation + BI remains the control stack as manufacturers chase closed-loop revenue reporting and scenario planning during demand volatility. (Deloitte flags data accuracy and faster decisions as board-level priorities.) (Deloitte, Deloitte)
AI moves from pilot to production: case studies show large portions of content ops automated (80% in one B2B CMO’s account), freeing teams to focus on strategy and field proof. Expect widespread adoption of AI copilots for content, analytics, and sales enablement. (Business Insider)
In parallel, agentic/predictive ad frameworks mature (academic to commercial): multimodal, persona-aware agents for ad generation, and causal optimization stacks for revenue ops. (arXiv, arXiv)
Expert Commentary (Synthesis)
Deloitte: Manufacturers confront cost and policy uncertainty; winning teams accelerate data-driven decisions and address enduring talent shortages—marketing must align with operations to prove ROI.(Deloitte, Deloitte)
GroupM: Ad growth outpaces expectations; by 2025 the market crosses $1T, increasing auction pressure and rewarding creative/targeting efficiency. (The Wall Street Journal)
Practitioner view (Aviatrix CMO): AI can automate the majority of production tasks but still needs human oversight for empathy and trust—apply “human-in-the-loop” in industrial contexts.(Business Insider)
Expected Breakout Trends
Agentic AI in Demand Gen: Always-on creative testing and audience micro-segmentation; guardrails needed for brand/claims.(arXiv)
Causal & Prescriptive Analytics in RevOps: From dashboards to what-to-do engines (bandits, constraints) operationalized in CRM/sales motions.(arXiv)
Zero-Click/AI-SERP SEO Tactics: Optimize for on-page answers, structured data, and video snippets as AI overviews siphon clicks; build direct demand capture (calculator/demo) to offset lost traffic. (Deloitte)
Industrial Video Systems: In-house micro-studios and template-based motion design compress production cycles (seen in B2B teams reporting drastic video cost drops with AI).(Business Insider)
Expected Channel ROI Over Time (2025–2026)
Expected Channel ROI Over Time
Manufacturing & Industrials • ROI Index (Base = 100) • Q1 ’25 → Q2 ’26
Adoption path for key marketing & RevOps innovations in the sector
Emerging
2024
Early Adoption
2025
Scaling
2026
Mature
2027
Emerging (2024)
AI Creative Generation
Early Adoption (2025)
Predictive ABM
Scaling (2026)
Causal RevOps AnalyticsZero-Click / AI-SERP SEO
Mature (2027)
Agentic AI Systems
12. Appendices & Sources
Full Source List (with Hyperlinks)
Below is the complete set of verified external sources used across Sections 1–11. Sources include industry reports, government/industry manufacturing data, ad market forecasts, marketing research, and economist/analyst publications.
The global FinTech industry generated approximately US $201.9 billion in 2024 and continues to expand at a double-digit CAGR, driven by digital-first adoption, mobile payments, and open-banking ecosystems. Marketing activity within the sector has matured beyond early-stage growth hacking to focus on sustainable, data-driven customer engagement.
Digital marketing budgets in the financial services/FinTech space are up ~45 % over the past three years (PYMNTS, 2025), signalling aggressive competition for user acquisition and brand visibility.
Shifts in Customer-Acquisition Strategies
From performance to brand-plus-trust: Campaigns now balance ROI-driven channels with brand storytelling emphasizing security, reliability, and transparency.
Privacy-first personalization: Marketers are investing in first-party data and compliant consent management as cookies phase out.
Omni-channel orchestration: Paid search, social, influencer, and partner ecosystems (embedded finance) are increasingly integrated.
Retention over reach: With CAC rising, brands are prioritizing lifetime-value (LTV) and retention marketing (email, app engagement, loyalty).
AI-enabled creative: Generative-AI tools are shrinking production time and boosting volume (e.g., Chime, Klarna campaigns).
Summary of Performance Benchmarks
Summary of Performance Benchmarks (FinServ/FinTech, 2025)
Use these as directional guardrails; validate against your own funnel data and geo/product mix.
Funnel Stage
Key Metric
2025 Benchmark
Comment
Source
Awareness
CPM
≈ $11.50 avg (platform-dependent)
Costs trending up YoY; wide variance by platform and audience quality.
Notes: Benchmarks aggregate public sources and cross-industry reports. Actuals will vary by region, audience, product complexity, and compliance friction (KYC/AML).
Key Takeaways
Competition is intensifying: 45 %+ budget growth across FinTech advertisers.
Acquisition is costly: CACs often $80 – $150; focus must shift toward retention.
Personalization & AI are the new efficiency levers.
Trust remains the decisive brand differentiator.
Data-driven attribution and LTV tracking will define ROI leadership.
Directional targets for paid acquisition efficiency.
Note: Values are directional and may vary by region, product complexity, compliance friction (KYC/AML), and audience quality.
2. Market Context & Industry Overview
Total Addressable Market (TAM)
The global FinTech industry generated around US $201.9 billion in revenue in 2024. (DemandSage, scraping-coupons)
For the broader financial-services sector, the global market is projected to reach US $29.7 trillion by 2025, growing at ~6.4% CAGR from 2022. (CoinLaw)
One forecast projects the global FinTech market will grow from approx. US $209.7 billion (2024) to US $1,583 billion by 2033 (implied CAGR ~25 %). (Market Data Forecast, Fortune Business Insights, DemandSage) → This shows a very large addressable market and substantial growth potential for FinTech marketing.
Growth Rate of the Sector (YoY / 5-Year Trends)
From 2017 to 2024 the FinTech industry grew from about US $85.9 billion to ~US $201.9 billion — an implied CAGR ~11–12%.(DemandSage)
Growth has shown signs of deceleration (e.g., +8% projected for 2024 in one dataset) as the market matures.(DemandSage)
The FinTech segment is growing significantly faster than the broader financial-services market (e.g., 21 %+ YoY growth vs ~6 % for legacy financial services). (The Economic Times)
Digital Adoption Rate within the Sector
According to data, ~96 % of consumers are aware of FinTech “money transfer & payments” services.(DemandSage)
Adoption of cloud computing among financial institutions is expected to reach 90 % by 2025. (CoinLaw)
70 % of financial-services companies are projected to have fully adopted digital transformation initiatives by 2025. (WifiTalents) → This demonstrates strong momentum in digital adoption — marketers can increasingly assume digital channels, mobile usage and expect shifts in how customers engage.
Marketing Maturity: Early, Maturing, Saturated
The FinTech / financial-services marketing environment can be characterised as maturing:
Early-stage: many entrants still use growth-hacking tactics (referral, virality).
Maturing: performance marketing + brand building + retention are now more important.
Some segments may approach saturation (especially in mature markets), meaning differentiation, cost control and retention become critical.
Given the relatively large TAM and still-elevated growth rates, there is still opportunity for expansion, but also rising competition and higher marketing costs.
Industry digital ad-spend over time
FinTech Digital Ad Spend Growth (Indexed, 2020–2024)
Indexed to 2020 = 100. Illustrative trend reflecting ~+45% cumulative growth over the last three years.
Notes: Index constructed for visualization; aligns with reported ~+45% FinTech ad-spend growth over ~3 years.
Consider validating against your internal spend data and primary sources (e.g., PYMNTS 2025).
Gen Z & Millennials, mobile-first, value speed + UX; heavy users of digital wallets and contactless payments (e.g., in the UK, 34% used mobile contactless monthly in 2023; 42% registered a digital wallet). (Financial Times)
Privacy-aware but personalization-hungry—trust hinges on data protection; many consumers will share data for better guidance if value is clear. (Boston Consulting Group, MX)
Financial confidence varies (especially Gen Z), making clear education and simple onboarding essential to conversion. (New York Post)
SMB (B2B) FinTech
Owners/finance leads seeking payments, lending, invoicing, and cash-flow visibility with easy integrations (accounting, e-commerce) and fast support.
Enterprise/FSI buyers
CIO/CMO/risk leaders prioritizing security, compliance, and ROI; growing interest in open banking and AI-powered experiences—tempered by trust and regulation requirements. (Mastercard, THETARAY)
Key Demographic & Psychographic Trends
Mobile dominates the day-to-day: ~48% of US consumers used mobile banking in 2023, and usage has tripled in under a decade. (Desktop/branch use declined.) (WalletHub)
Open-banking momentum: UK open-banking penetration reached ~14% of digitally active customers (Jan 2024), up from 11% in June 2023—evidence of growing comfort with data-sharing for utility. (Open Banking, Open Banking)
Trust calculus is shifting: Data protection is the #1 driver of financial trust (EY survey); notably, a sizable share of consumers now say a FinTech is their most-trusted financial brand. (Samsung Business Insights)
Conversion: Mobile sign-up with KYC; minimize steps, enable progressive onboarding; offer instant verification where permitted.
Activation: First-transaction prompts, nudges; dynamic education (e.g., “how to” money flows) for lower-confidence segments.(New York Post)
Retention/Loyalty: Personalized offers and alerts; card-linked rewards; embedded experiences across partner apps.(Boston Consulting Group, Financial Times)
Offline/Hybrid: Advisors/branches still matter for complex products (mortgage, wealth); ensure omni-channel handoffs.
Shifts in Expectations (Privacy, Personalization, Speed)
Privacy & control: Consumers expect clear consent and value exchange; trust improves when brands show how data is protected and used. (EY findings summarized) (Samsung Business Insights)
Personalization at scale: Most consumers expect tailored experiences; top asks include personalized insights, proactive notifications, and relevant partner offers.(Boston Consulting Group, MX)
Speed & convenience: Mobile-first flows, instant decisions/payments; digital wallets continue to normalize tap-to-pay. (WalletHub, Financial Times)
Regulatory backdrop matters to UX: US open-banking rules are in flux (recent injunction), which may slow some data-sharing experiences and requires messaging adjustments by marketers. (Reuters)
Regulatory risk; long procurement; security & integration scrutiny
“Bank-grade security at cloud speed.” · “Auditable ROI & controls.”
Industry conferences, white papers, analyst briefings, ABM/LinkedIn
Funnel Flow Diagram of Customer Journey
Funnel Flow Diagram — Customer Journey
Mobile-first journey with typical FinTech touchpoints. Adapt messaging and KPIs by stage.
Notes: Add your KPIs by stage (e.g., CPM/CTR for Awareness, CVR for Conversion, DAU/WAU for Activation, LTV/Churn for Retention). Ensure compliant consent flows throughout.
Note: CAC and CPC vary significantly by geography, audience size, and product type. Always benchmark against your first-party data.
Commentary & Insights
Acquisition cost (CAC) remains a critical pressure point in FinTech marketing: as more players enter the market, CPCs, CPMs and overall spend are rising. The ~$110 CAC for paid search highlights that you cannot rely solely on low cost acquisition any more.
Retention channels (like email) are under-invested relative to acquisition; with a ~$28 CAC and ~4.9 % conversion rate benchmark, email offers disproportionately high ROI.
SEO remains a high-value channel for long-term growth: despite slower time to value, its lower cost basis means that once SSR (search-share) is built, it becomes a strong competitive moat.
Younger audiences require newer channels (e.g., TikTok, influencer) — though lower conversion means you need greater volume or stronger upstream funnel work (brand, trust) to support it.
The “supplement” FinTech-specific benchmarks (CVR ≈ 5–10%, CPA ≈ US$50–150) underscore that top performers are achieving much better than generic averages; this implies there’s performance headroom if you optimise well.
Attribution and measurement become especially important: given the multiple channels, longer decision-cycles and regulatory/licensing friction in FinTech, understanding which channel delivered true quality (e.g., KYC completed, deposit initiated) is essential.
% of budget allocation by channel
FinTech Marketing Budget Allocation by Channel (Illustrative, 2025)
Single stacked bar sums to 100%. Adjust to your company stage and region.
Note: This split (Digital ≈ 33%) mirrors public benchmarks for FinServ/FinTech. Tune by maturity: early-stage may bias toward Paid Search/Social; scale-stage shifts more into Brand/PR and Retention.
5. Top Tools & Platforms by Sector
Overview
FinTech and Financial Services marketers increasingly rely on an integrated MarTech stack that connects customer data, compliance, analytics, and personalized engagement. In 2025, the focus is shifting from tool quantity to data unification, AI-assisted decisioning, and regulatory-compliant automation.
Core Martech Stack Components
1️⃣ Core Martech Stack Components
Category
Leading Tools (2025)
Market Trend / Insight
CRM (Customer Relationship Management)
Salesforce Financial Services Cloud, HubSpot, Zoho CRM, Microsoft Dynamics 365
Still the backbone of lifecycle management; deep integration with KYC/AML data gaining traction.
Marketing Automation
Marketo, HubSpot, ActiveCampaign, Iterable
Adoption up 19% YoY; predictive scoring and AI-driven segmentation now standard.
Demand surging post-GDPR/CPRA; integration with CRM and marketing automation platforms increasing.
Advertising & Tracking
Google Ads, Meta Ads Manager, TikTok Ads, LinkedIn Campaign Manager
CPM up ~18% YoY across finance verticals (Statista 2025).
AI / Personalization Engines
Jasper, Persado, Mutiny, Dynamic Yield
Reduces campaign production time by 40–60%; enabling scale personalization with compliance.
Adoption & Satisfaction Matrix
2️⃣ Adoption & Satisfaction Matrix
Tool Category
Adoption Level
User Satisfaction (avg)
2025 Trend
CRM
92%
★★★★☆
Mature and indispensable; integrations with compliance and KYC data expanding.
Marketing Automation
84%
★★★★☆
High ROI, but tool overlap becoming a cost issue; consolidation underway.
CDP
41%
★★★☆☆
Rapid growth as cookie deprecation drives first-party data investments.
Analytics / BI
76%
★★★★☆
Strong adoption; deeper focus on attribution, LTV, and predictive cohorts.
Consent Management
63%
★★★★☆
Critical in regulated markets; APIs increasingly link to CRM/CDP ecosystems.
AI Creative & Content Tools
29%
★★★☆☆
Early but fast-growing; projected to reach 50% adoption by 2026.
Key Integration Trends
Unified Data Layer: FinTech marketers are consolidating marketing, transaction, and behavioral data for personalized, compliant engagement.
API-First Ecosystems: Preference for open APIs enabling faster integration across CRM, CDP, and analytics platforms.
Real-Time Personalization: Growing adoption of systems that trigger actions based on real-time events (e.g., a declined transaction or first transfer).
AI + Compliance Fusion: Tools like Salesforce and OneTrust are collaborating to ensure personalization doesn’t violate privacy laws.
Cost Rationalization: According to McKinsey (2025), 61% of CMOs report cutting unused martech tools to consolidate value and simplify workflows. (Source: Business Insider – McKinsey CMO Report 2025)
Toolscape quadrant: adoption vs. satisfaction
Toolscape Quadrant — FinTech Martech Tools (2025)
Adoption Level (%) on the X-axis; User Satisfaction (1–5) on the Y-axis. Points are illustrative benchmarks.
Reading the chart: Tools in the upper-right quadrant combine high adoption with high satisfaction (leaders).
Lower-left indicates nascent categories; monitor for fast movers.
6. Creative & Messaging Trends
Which CTAs, hooks, and messaging types perform best
Emphasize trust & transparency: In the financial/FinTech sector, consumers expect clear cues around security, regulation and reliability—messages like “bank-grade security”, “regulated”, “your data, your control” perform well. (Wallester, The European Financial Review, Envisionit)
Focus on speed and convenience: Hooks such as “Open in minutes”, “Instant transfers”, “Zero fees” resonate strongly, especially with younger, mobile-first segments.
Lead with value and relevance: For example “See how much you can save”, “Unlock rewards”, “Get personalised insights” are effective in reducing friction.
Use channel-appropriate CTAs:
Search/display: “Get started”, “Download the app”
Social/influencer: “Join X million users”, “Watch how we did it”
App-in/onboarding: “Tap to activate”, “Start your first transfer”
Address friction explicitly: Messages like “No paperwork”, “Skip the branch”, “Instant approval” help overcome typical finance onboarding barriers.
Short-form video (15–30 s mobile-first) is now central to reaching younger demographics and conveying complex value simply. For example, one report states short videos explaining financial products in plain language are “very successful” on platforms like TikTok and Instagram. (Wallester, Trackier)
UGC / influencer-led creatives count more than ever: Financial brands are collaborating with authentic creators (not just celebrities) to translate concepts like fintech, savings, investing for younger audiences. (Wallester)
Interactive/carousel formats: Tools such as driven quizzes (“How much can you save?”), calculators, and multi-slide carousels help engage users and qualify them in a lower-friction way.
Embedded video + live streaming: Some FinTech brands now run live Q&A sessions, demos or “ask me anything” video formats to build credibility and break down complicated financial topics. (Wallester, Magnetto)
The creative production process itself is under transformation: One example: Chime cut ad production time by ~60% using generative AI tools. (Business Insider)
Sector-specific messaging insights
Security & regulation matter more than ever: Because consumers are entrusting their money/data, messaging must highlight credentials (licences, encryption, “trusted by millions”). Any hint of ambiguity hurts trust. (The European Financial Review)
Personalisation = expectation not novelty: Generic one-size messaging is failing. The best campaigns craft messages that reflect user behaviour, financial goals or life-stage. For example, a money-app might highlight “Your savings goal is X; here’s how we help you hit it”.(Wallester)
Education + storytelling: Because FinTech products can be complex, using educational content (explainers, stories, realistic scenarios) builds trust and engagement.(Wallester, Magnetto)
Tone & brand voice: More FinTech brands aim for a humanised tone—less “bank-speak”, more conversational, playful (especially for younger users) but still credible.
Cross-channel consistency: Given that consumers may interact across app, web, social, email, it’s essential that the message is aligned across touch-points—not just a variation but a cohesive narrative.
Swipe File-Style Collage or Example Gallery
Swipe-File Collage — FinTech Ad Examples
Four ad-style mockups you can paste into slides. Replace headlines or colors to match your brand.
UGC/Reels format · Voiceover + subtitles · Trust & benefit-firstApp-install creative · Speed & fee transparency emphasizedCarousel concept · Education + interactive tools to reduce frictionInfluencer/UGC + bold value prop · Clear single CTA
Tip: Pair each creative with stage-specific KPIs (e.g., view-thru/video completion for UGC; CVR and KYC-pass for app installs).
Best-Performing Ad Headline Formats
Best-Performing Ad Headline Formats — FinTech Sector (2025)
Tested headline styles that drive engagement and conversion in financial services marketing. Adapt to tone, target audience, and compliance requirements.
Headline Format
Why It Works
“Open your account in 2 minutes”
Emphasizes speed and simplicity — a core differentiator for digital banking and wallet apps.
“No monthly fees ever”
Addresses cost-sensitive segments directly and builds instant trust through transparency.
“Trusted by X million users – built for you”
Leverages social proof and credibility while keeping a personalized tone.
“Unlock rewards & bonus X % on transfers”
Combines tangible benefit with aspirational tone — strong performance in loyalty and payments verticals.
“Finance designed for Gen Z”
Signals relevance to younger audiences seeking modern, mobile-first solutions.
“Your data, your control”
Directly appeals to rising privacy and security awareness — key trust driver in FinTech UX copy.
“Get paid 2 days early”
Specific, tangible time-based benefit proven to drive strong CTR and signup intent for neobanks.
“Earn up to X % APY on savings”
Performance-driven numeric headline; anchors reader attention on measurable gain.
“Built to help you spend smarter”
Emotional and functional blend; reinforces empowerment and financial literacy messaging.
Tip: Pair quantitative headlines (“Save $X per month”) with credibility markers (licenses, security badges) for higher financial-sector CTR.
Sources: Wallester 2025 FinTech Trends Report, Business Insider Marketing Insights 2025.
7. Case Studies: Winning Campaigns
Case Study 1: Chime (USA – Neo-Bank)
Objective: Increase brand visibility, accelerate sign-ups, and reduce creative/agency costs. Insight & Strategy: Chime leveraged generative-AI tools to dramatically reduce campaign production time and dependency on external agencies. According to a Business Insider interview, they cut their production time by ~60 %. Channel Mix:
Digital performance (search + social)
In-house creative production using AI for imagery, copy, and templated ads
Brand-building via influencers and mobile-first content Results/Outcomes:
Campaign production time reduced from ~10 weeks → ~4 weeks
Cost savings on agency fees and production
Improved agility: more campaigns, faster test-and-learn cycles Why It Worked:
Efficiency gains unlocked more creative velocity
Fresh, mobile-first creative resonated with younger audiences
Integration of brand + performance helped scale user acquisition while building long-term brand equity
Case Study 2: Klarna (Global – BNPL/Payments)
Objective: Scale global marketing rapidly while controlling cost per acquisition and improving creative volume. Insight & Strategy: Klarna deployed generative-AI for imagery and creative production, enabling faster campaign roll-outs. (Reported annual savings of ~US $10 million.) Channel Mix:
Global digital display + social + influencer partnerships
Creative automation for campaign assets, localised across multiple markets
Strong brand-marketing component to support uptake of BNPL products Results/Outcomes:
Creative cycle time reduced from ~6 weeks → ~1 week
Over US $10 million in cost savings from reduced production/agency spend
Higher volume of campaigns, increased regional variation and faster experimentation Why It Worked:
Scale + speed: ability to localise and deploy creatively in many markets quickly
Cost efficiency: freed budget to test more channels and creatives
Balanced brand + performance: while acquisition campaigns scaled, brand messaging strengthened trust in bigger markets
Campaign Card Template:
Campaign Card — Before/After Metrics & Creative
Creative: Replace with your final ad (image/video). Keep headline ≤ 6–8 words.
FinTech Marketing Funnel — Awareness to Loyalty (2025)
Layered funnel with black text labels. Widths are proportional to relative user share at each stage.
Note: Percentages are illustrative. Replace with your stage conversion data for accuracy.
9. Marketing Challenges & Opportunities
Challenges
Rising acquisition costs – As competition intensifies across the FinTech sector, CPM, CPC and CAC are climbing. For example, ad-spend in FinTech has increased by ~45% over the past three years.
Privacy and regulatory shifts – The end of third-party cookies, stricter consent frameworks (e.g., GDPR, CPRA), and financial-services regulation (AML/KYC, open banking) all place new burdens on targeting and marketing-automation.
Attribution complexity & measurement lag – Multi-touch journeys, longer onboarding or lifecycle events (account funding, investment), and transaction-based conversion cycles complicate attribution, making true ROI measurement challenging.
Organic reach decay – Social platforms are reducing algorithmic reach for unpaid posts; attention shifts to paid or influencer/UGC-led legions for visibility.
Trust & friction trade-offs – To scale acquisition, FinTech marketers must balance ease (speed, UX) with trust (security, compliance). Friction (KYC delays, identity verification) remains a conversion barrier.
Opportunities
Retention & LTV leverage – With acquisition getting harder and more expensive, investing in retention (e.g., lifecycle email, in-app messaging, cross-sell) yields richer ROI via higher LTV.
Personalisation & first-party data – As IDFA/third-party cookie deprecation accelerates, firms that build rich first-party data, leverage behavioural triggers and realtime personalisation will gain competitive advantage.
AI & automation – Generative-AI tools, automated creative production, real-time audience segmentation, and chat/voice assistants are increasingly usable and cost-effective. Case studies show production times cut by 40–60%.
Embedded finance & partnerships – FinTechs can tap into non-financial platforms (commerce, retail, gaming) via embedded finance to reach new audiences, often at lower cost.
New channels & formats – Short-form video, creator/UGC content, influencer trust signals, and novel placements (in-app, live-stream) provide growth spots especially for younger segments.
Risk/Opportunity Quadrant
FinTech Marketing: Risks vs. Opportunities (2025)
Left side highlights key risks; right side pairs each with its corresponding opportunity. Axis lines divide short-term vs. long-term focus.
How to use: Replace labels or add rows to match your plan. Map initiatives onto the right-hand boxes and link to KPIs (e.g., LTV, churn, CPA).
10. Strategic Recommendations
Playbooks by Company Maturity
Playbooks by Company Maturity — FinTech / Financial Services
Align channels and tactics to stage-specific goals. Validate against your CAC/LTV, funding runway, and regulatory context.
Company Stage
Focus Areas
Recommended Channels & Tactics
Startup (≤ 3 years)
Rapid acquisition; validate PMF; tighten CAC; build trust & credibility from day one.
Paid Search & Paid Social for intent + reach; creator/UGC video; referral & waitlist mechanics;
lightweight SEO (problem-led content); conversion-optimized landing pages; trust badges (licenses, encryption);
fast onboarding (progressive KYC); lifecycle email for activation.
Growth (3–7 years)
Scale efficiently; improve unit economics; strengthen retention & LTV; expand channels and geos.
Rebalance toward SEO/Content (calculators, comparisons) and Email/CRM (segmented drips, cross-sell);
creative testing at velocity (short-form video, dynamic ads); partner/affiliate programs;
multi-touch attribution, incrementality testing; in-app prompts for first deposit/transaction;
onboarding personalization using first-party data.
Use this matrix to map channel-level tactics to concrete, measurable outcomes. Replace examples with your KPIs (e.g., CAC, CVR, LTV, KYC-pass, funding rate).
Expert panels; product demos; live Q&A; gated replays; integrated nurture sequences to SQL/MQL.
Educate & qualify; drive SQLs; accelerate consideration for complex products.
Tip: Tie each row to a single KPI and threshold (e.g., “Paid Search → CAC ≤ $120; KYC-pass ≥ 80%”). Review weekly and shift budget based on marginal ROI.
11. FinTech Industry Outlook — Next 12-24 Months
Key Forecasts
The FinTech sector is projected to continue strong growth. A recent forecast sees global FinTech market size rising significantly through the mid-2020s. (Wallester, Trackier, upGrowth)
Marketing budgets in digital finance are shifting: more spend allocated to retention and organic channels as acquisition costs climb. (upGrowth, Magnetto)
Technologies like AI/gen-AI, embedded finance, open banking and first-party data will drive both competitive pressure and opportunity. (Marqeta, Envisionit)
Predicted Shifts in Channel ROI
Predicted Shifts in Channel ROI (2024–2026)
ROI forecasts are normalized against current-year performance. These directional shifts are based on FinTech marketing trend data (Wallester, UpGrowth, Marqeta, 2025).
Low-cost, high-LTV channel; retention budgets expanding as acquisition costs rise.
Organic / SEO
Long ramp-up
High
Organic search & content gain traction as sustainable acquisition lever; focus shifts to E-E-A-T and zero-click SEO.
Short-form Social / Influencer
Experimental
Maturing
Creator-led video and influencer trust signals deliver strong reach and better engagement in Gen Z cohorts.
Partnerships / Embedded Finance
Low
Rising
Distribution through non-financial platforms (retail, commerce, gaming) lowers CAC and diversifies revenue sources.
Insight: Paid performance channels are approaching saturation, while first-party and creator-driven ecosystems are emerging as higher-ROI alternatives for 2025–2026.
Expert Commentary
“In 2025, FinTech marketing must balance innovation (AI, embedded finance) with trust & transparency more than ever.” — from a detailed industry analysis.(Wallester, Magnetto)
According to the William Mills Agency, AI will move from “nice to have” to a central marketing pillar for FinTechs, especially for cost-efficiency and creative production. (William Mills Agency)
As per the BDO 2025 FinTech predictions: “declining interest rates, regulatory shifts and Blockchain/embedded finance acceleration will create both deep disruption and growth levers.” (BDO)
Breakout Trends to Watch
Zero-Click SEO & Conversational Discovery: With voice assistants and chatbots, many financial product searches will bypass traditional search results. Optimising for “instant answers” becomes critical.
Gen-AI-Driven Campaign Production: Rapid creative testing and versioning — companies producing many dozens of creatives per week will outpace legacy players.
Embedded Finance Ecosystems: Financial services will increasingly appear inside non-financial platforms (commerce, gaming, wellness) gaining access to new users and lower CAC.
Privacy-First Performance Marketing: With evolving regulation and cookie deprecation, performance marketers will shift toward first-party data lakes, owned audiences, and context-based targeting.
Ecosystem Partnerships over Ad-Spending: Rather than only bidding more, smarter growth will hinge on partner integrations, distribution deals and embedded offers.
Expected Channel ROI Over Time
Expected Channel ROI Over Time — FinTech Marketing (2024–2026)
Relative ROI index (base = 1.0 in 2024). Values are illustrative to show expected direction of change.
Note: Replace ROI values with your projections. Typical expectation: paid search slows slightly as costs rise; retention (Email/CRM), organic, and partnerships gain share.
For years, marketing success has mostly come down to gathering insights, crafting a message, and measuring results. Every breakthrough, from split testing, programmatic ads, to new marketing strategies, every breakthrough helped fine-tune marketing efforts. Regardless of the method, marketers spent weeks developing campaigns and months testing variations. But now we’ve got generative AI bending the rules and assisting in this process from start to finish.
Today, it’s not only what brands say to their target audience—it’s also what marketers say to AI systems. With generative AI, it’s no longer just what you say to your audience. Now you need to consider what you say to the AI machine that helps you build, write, design, and optimize your campaigns. The instructions you give to large language models determine the desired output, the desired tone, and even the desired length of your campaigns. This is called prompt engineering, and it’s the ability to turn precise instructions into high-performing marketing assets using prompt engineering techniques to produce high-performing AI generated content and AI content across channels.
Rather than writing endless drafts, marketers refine effective prompts that shape the AI models’ thought process and reasoning process. Instead of only testing headlines, they test phrasing logic. And instead of only briefing creative teams, marketers now brief AI directly with concise prompts, structured inputs, background information, additional context, and clear instructions. What used to take an entire room of strategists, copywriters, and designers can now be accomplished with a series of well-engineered prompts.
Although it’s powerful, prompt engineering can’t replace the human marketer, but it does increase their power. Prompt fluency allows marketers to generate more relevant content, automate tasks, align output with brand voice, and deliver specific responses for specific tasks. This shift is completely rewriting the rules of digital marketing and anyone who doesn’t embrace effective prompt engineering will be left in the dust.
Prompt engineering is exploding
Prompt engineering isn’t some fringe tech hobby. It’s actually becoming a full-blown industry and marketers are starting to recognize the potential. In 2023, the prompt engineering market had an estimated value of $222.1 million and is projected to hit $2.06 billion by 2030. In the United States alone, prompt engineering revenue surpassed $61 million in 2023 and is set to reach $546 million by 2030.
While it has yet to become a staple, early adoption is spreading fast. One survey of 1,900 marketers found that only 38% of organizations train employees on prompting, 40% are experimenting, and 26% are integrating AI tools into their workflows. However, even though a lot of companies are using prompt engineering, many still don’t have a structured prompt management toolset.
Prompt engineering has the potential to increase efficiency and creativity at scale, but only when marketers know how to speak to AI to generate the desired results. Now, knowing how AI interprets instructions has become just as critical as briefing a designer or copywriter.
The mindset shift from “using a tool” to “prompting strategy”
Creating a prompt is no longer a one-off thing. It's becoming a strategic layer inside content marketing, ad creation, email copywriting, and social media marketing.
· Prompt as a strategic layer. Rather than viewing generative AI as a tool to use once in a while, forward-thinking marketers are putting prompts at the heart of campaign architecture. They craft tone, personality, and rules, then generate multi-channel assets with generative AI tools and AI platforms. Prompts effectively become part of the campaign DNA.
· Prompt versioning and governance. Prompts now evolve like creative assets. Teams track performance across variants, store different prompts, and measure prompt success. This is critical because continuously optimizing your prompts can yield a 156% performance improvement over static prompts in just one year.
· Prompt templates and modular building blocks. To save time, marketers are building reusable prompt modules like headline and subject line generators, emotion amplifiers, call to action builders, and combining them into custom prompt pipelines. This modular approach ensures consistency and significantly improve creative workflows.
· Integrating prompt output into other systems. Once prompt-generated output is created, it’s integrated into ads, content management systems, email flows, chatbots, and more. In this way, prompts become part of the operational layer, enabling content generation and dynamic personalization.
As marketers shift more toward prompt engineering, the difference between passive users and expert prompt engineering skills will become dramatic.
Prompt engineering can scale personalization
Everyone uses personalization, but AI generated assets can help you reach a level of hyper-personalization that will scale. For example, with zero shot prompting, few shot prompting, or one shot prompt techniques, AI can generate thousands of unique copy variants tailored to different market segments within seconds. You can also condition output by context. For example, a basic prompt like “customer has browsed twice, abandoned cart, currently sees discount, tone=more urgent but helpful”) becomes far more powerful when enhanced with few examples, structured guidelines, and input data. That level of dynamic, conditional adjustment was previously only possible when done manually and that doesn’t scale quickly.
To maintain evergreen content, prompts can be adjusted on the fly based on real-time signals like weather, news trends, and even sentiment changes. For example, a prompt template can fetch a live weather statement into the prompt (“It’s rainy today in New York, friendly tone: How’s the weather impacting your plans?”).
This is content creation at scale—impossible through manual workflows.
Prompt engineering supports higher efficiency
Since prompts can replace a huge chunk of manual marketing efforts like editing and sequencing, marketing operations are getting leaner and faster.
· Reduced creative bottlenecks. Rather than waiting for design, copy reviews, multiple rounds of editing, or outsourcing, a prompt can generate multiple first drafts instantly. That can shave off days from a campaign timeline.
· Lower marginal cost per iteration. Once you have a good prompt template, generating the 10th or 1,000thvariant has a near-zero cost. You’re paying for model compute, not for each creative iteration.
· Smarter automation handoff. Rather than rigid rule-based automation, prompts make the automation process smarter. For example, you can set triggers that re-prompt variations and swap in new creatives when certain metrics drop.
· Prompt-based QA and content auditing. Prompts can also audit prompt-generated content for brand compliance (tone, keywords, policies) before going live. In this sense, prompts become internal editors that check AI output.
· Reduced reliance on externals. Since many routine creative tasks can live internally in prompting workflows, agencies and contractors become less critical for mid-tier tasks, which frees up budget and allows internal teams to focus on strategy.
Using AI to make operations leaner allows marketing teams to dive deeper, adapt more, and use human time for high-leverage work.
AI can scale creativity
Although prompt engineering excels at increasing efficiency, it also helps marketing teams express, refine, and scale insights. Creative teams can sketch out broad boundaries and creative ideas and then feed it into prompts that flesh out the whole skeleton. Prompts can also be used to encode style guides and brand voices. The AI output will be constrained to brand voice from the first draft onward, reducing errors and the need for constant back-and-forth.
Since prompts are lightweight, creatives can test more variations in hours rather than having to wait a week to analyze and create a better prompt. Generative AI doesn’t replace or sideline creativity. It just restructures how creative work is expressed and validated.
Prompts can feed directly into ad tech
Some advanced platforms utilize APIs to feed prompts directly into ad engines where a prompt is used to automatically generate a headline, ad copy, or variation. Instead of uploading CSVs with fixed copy, marketers provide structured inputs that generate headlines and variations in real time.
Marketers have been dynamically creating content for years, but it still relied on feeding the system with manual options to select from. Now prompts can dynamically generate copy and assets that adapt to the segment or performance signals in real time.
Prompts can also power chatbots and voice assistants that act as real-time marketing agents. Good prompts also drive social media posts and content generation in email workflows. Even Adobe is getting in on this by rolling out AI agents that adapt content in real time by customizing web copy based on advanced AI tools.
The risks marketers must watch out for
Now that prompt engineering is rewriting the rules of marketing, there are some risks and things to watch out for. AI models are constantly updated and a prompt that once performed well can lose its power overnight. Continuous prompt tuning is essential. You can’t assume any prompt will retain its accuracy.
Other risks include:
· Bias, hallucination, and misinformation. AI is known to produce wrong facts and propagate bias. Without careful prompt constraints and human validation, marketing content could go off the rails with false claims. Always include fact-checking when using AI generated content in your marketing campaigns.
· Brand voice erosion. When prompts are too general, the output can drift from brand voice and messaging guidelines. This can dilute brand consistency and cause legal problems in some industries. Avoid vague prompts and use clear communication. Human oversight is a must.
· Regulation, privacy, and data leakage. Depending on how prompts reference private training data, there’s a risk of compliance violations. Marketers need to ensure prompts don’t expose sensitive information or violate user privacy policies, and the only way to check this is through human verification.
· Overconfidence in AI output. While AI output can be great, it’s rarely good enough as-is. In marketing, small tone and nuance issues can cost conversions. Treat AI output as a draft, not a final piece of copy. Human oversight is critical.
Just because AI makes it easier to create content doesn’t mean you don’t need guardrails in place.
The Risks Marketers Must Watch Out For (Prompt Engineering)
Risk
What It Is / Why It Matters
How to Mitigate
Prompt drift & model updates
Models change frequently, so prompts that once performed well can degrade suddenly, hurting consistency and results.
Continuously re-test and tune prompts; version prompts and tie each version to model IDs/dates; set monitoring to detect performance drops.
Bias, hallucination & misinformation
AI can produce incorrect facts or biased content, risking credibility, compliance issues, and brand trust.
Add factual constraints and citations in prompts; require human fact-checking; use guardrail checklists and automated validation passes before publishing.
Brand voice erosion
Overly generic prompts lead to off-brand tone, messaging drift, and potential legal exposure in regulated sectors.
Encode brand voice and do/don’t lists in system prompts; use style guides and example pairs; run pre-flight brand QA on outputs.
Regulation, privacy & data leakage
Prompts that expose or misuse private data can violate laws/policies and create security risks.
Redact PII; use approved data sources; limit sensitive context; follow privacy-by-design; add compliance reviews before deployment.
Overconfidence in AI output
AI drafts can look polished but miss nuance, leading to conversion loss or inaccurate claims if shipped as-is.
Treat AI as a first draft; require human edits; A/B test before scaling; set thresholds for tone, clarity, and accuracy.
Prompt engineering is an essential marketing skill
As prompt engineering rewrites the rules of marketing, it also becomes an essential marketing skill. Content marketers need to learn how to think in terms of prompt logic by setting constraints, injecting context, layering instructions, chain of thought prompting, zero shot, one shot, and few shot prompting, how to shape the AI's thought process, and how to align output with key points. It’s like learning how to brief a designer except you’re briefing an AI system.
Although a standalone prompt engineer role may not be necessary, prompt fluency is becoming part of the standard marketing role. Marketers who can prompt well will outshine those who can’t.
This is a rapidly evolving skill that requires adopting new techniques as models are updated and APIs are expanded. Marketers who learn prompt engineering need to be supported by an environment that encourages continuous learning.
Performance measurement to track prompt ROI
If prompt engineering is going to change the game in marketing, it’s crucial to have a measurement framework in place. You need:
· Prompt-level analytics and feedback loops. Track which prompt versions yielded which outcomes (like CTR, conversions, engagement). Tag and version your prompts so you can split test any changes with the prompts themselves, not just output.
· Attribution or prompt uplift. When a campaign improves, you need to know if it was the prompt, the creative, the targeting, or even the model upgrade. Use controlled baseline tests (fix all variables except prompt) to isolate the impact.
· Cost per variant vs. marginal lift. Measure marginal lift per variant. For example, if variant #22 adds negligible lift, stop there. The ROI curve for prompt variants is sharper than traditional creative variants.
· Longer-term prompt drift tracking. As prompts degrade, track temporal shifts in performance. If prompt output declines over weeks you’ll know when to refresh or retire your prompts.
· Model version impact layering. Since AI models evolve constantly, you need to track which model version was used with each prompt. A prompt that worked well on GPT-3 may need adaptation for GPT-4 or future models. Your performance metrics need to account for this difference.
Prompt-driven marketing campaigns require specific measurements. If you don’t measure prompt performance directly, you can’t improve it.
The future of prompt-infused marketing
The future of marketing is shifting fast and it’s not far-fetched to think prompt engineering will eventually turn autonomous. Future agents will dynamically adjust prompts based on real-time feedback, performance, and model states. The system will become its own prompt strategist and there will be “meta controllers” who monitor and alter prompts.
As prompt generation matures, we’ll likely see more prompt recipes sold and traded on prompt marketplaces. There may even be agencies who license prompt libraries optimized for specific industries. We are already seeing this on a small scale right now on online courses.
However, as prompts become more widely used, industry regulators will likely define prompt ethics, standards, and disclosure rules. This will create yet another set of rules marketers need to align with to maintain transparency and stay legal.
We’re still in the early stages, but prompt-infused marketing is set to be one of the biggest shifts in marketing we’ve ever seen.
Embrace the prompt revolution or be left behind
While it was once seen as a novelty, prompt engineering is changing the way brands execute high-level modern marketing campaigns. It empowers marketers to scale personalization, innovate creative workflows, streamline operations, and embed AI deeply across marketing channels. But it also demands new skills, measurement disciplines, and guardrails, empowering brands to scale personalization, improve content creation, generate AI content rapidly, streamline workflows, understand pain points, strengthen marketing strategy, craft better marketing prompts, create more relevant blog posts, and shape better subject line variations. Those who learn to think in prompt logic will lead while those who don’t will be left behind.
If you’re ready to get ahead of this revolution, don’t fumble around with trial and error. At Marketer.co, we can help you create prompt strategies and integrate prompts into your marketing engine. If you're ready to adopt AI deeply into your marketing purposes, reach out to us today to learn more.
The global bidets market and the SEO world have more in common than most people realize.
We’re both involved in cleaning up messes.
We’re both obsessed with improving the enhanced user experience.
And we’re both driven by technological innovations—though sometimes those innovations involve adjustable water pressure, heated seats, or the latest developments in smart technology.
But unlike toilet humor, the global bidets market conversation is no joke. The bidets market has seen significant growth in recent years, fueled by environmental concerns, water conservation, and rising awareness of the health benefits of improved personal hygiene. From bidet toilet seats to handheld bidets, portable bidets, and full bidet toilets, this space is expanding fast—especially as many Americans discover the eco friendly alternative to toilet paper.
To understand this growth, it helps to consider market growth factors such as sustainability concerns, innovation trends, and increased global adoption.
So when a brand-new player approached us wanting to break into this rapidly evolving market landscape, we knew two things:
Competition was tough—big key players like TOTO Ltd, Kohler Co, Bemis Manufacturing, Duravit AG, Boch AG, Brondell Inc, and Laufen Bathrooms AG were already investing heavily in advanced features like air dryers, remote controls, and customizable settings. heir aggressive push into the global market further intensified the competitive landscape, especially across North America.
The global bidets market size was exploding, and getting this client on page one during the forecast period would require targeted precision. With ongoing shifts in market size, consumer behavior, and innovation, breaking through required discipline.
But we never leave a brand behind—especially a brand designed to support behinds.
Wiping the Competition Clean
Breaking into the bidets market is no small task.
It's a growing industry, as more people in the United States—and especially North America—discover the many benefits of using a bidet, rather than wiping with toilet paper. That's good for business, but it also attracts a lot of competition. Breaking into the space would require us to bear down, analyze the obstructions, and push with enough force to overcome them.
On top of that, this particular client was a fairly new brand with minimal name recognition, practically no domain authority, and a single, fresh deposit in their SEO efforts.
Between rising consumer preferences, growing end use categories, and rapidly expanding market segmentation, new brands must compete with established brands offering premium bathroom fixtures, innovative toilet systems, and an array of modern bidets designed for enhanced comfort. This evolving market segmentation reflects diverse product adoption across demographics and regions.
Our client faced:
Minimal name recognition
A fresh domain with no authority
One lonely, tiny flush of an SEO presence
Competitors dominating North America, especially in residential and commercial sectors
But this was also a chance to prove how SEO can drive market opportunities, shape market share, and position even a new company among the major players.
These challenges were significant, but we could never leave a brand behind – especially a brand that supports behinds.
Not Just “Spray and Pray”: The Role of Targeted Precision
In an industry with massive market size variation across Asian countries, South Korea, Middle East, emerging markets, Canada bidets market, and the broader Asia pacific bidets market, a generic approach would have been a dereliction of doodie.
Instead, we focused on:
Key drivers of the growing demand
Key factors influencing consumer preferences
Market trends shaping buyer expectations
Market growth during the forecast period
Regional analysis highlighting market insights
Gaps that newer bidet companies could fill with product lines and marketing strategies
We also considered rising disposable incomes and shifting global demands that influence buying behavior in the bidets market.
That meant choosing only the most valuable potential keywords for our client to target, thus maximizing our effectiveness and minimizing costs. The keywords we selected were highly relevant to the industry, relatively minimal in competition, and yet affiliated with high search volume.
This allowed us to select keywords with the perfect balance of:
High search volume
Low-to-moderate competition
Clear potential customers
Strong commercial intent
Unique angles shaped by bidet usage, bathroom routines, and increasing increasing awareness
This golden ratio is ideal for any SEO strategy. You need keywords and phrases that are relevant, capable of facilitating organic traffic, and still approachable. This way, you can speak to the right audience, rank faster, and accumulate as much traffic as possible.
Tactics on a Roll
A few weeks later, we were on a roll.
· Strategic analysis and keyword research. Everything started with a strategic analysis, combined with keyword research. We wanted to know everything there was to know about bidets, including how they work, who uses them, who's selling them, and how we could attract the most attention to this particular brand. We studied the global bidets market from the rim up—including rim bidets, toilet seat bidets, ceramic bidets, and bidet attachments. Our research extended into market size trends, evolving product categories, and the role smart bidets play in shaping innovation standards.
We also added competitive tracking tied to market share, keeping an eye on emerging leaders.
We dove into:
Market bidets dynamics
Historic market size
Growth rate projections
Compound annual growth rate estimates
Regional outlook
Market drivers
Various trends
We researched competitors like Lixil Corporation, Drummond Bathroom Ltd, Drummond Bathroom, Xiamen Soothingware Sanitary, and others shaping trends in eco friendly, energy efficiency, health monitoring, and repair services.
This research helped us educate consumers, understand potential customer needs, and refine the client’s SEO foundation.
Once we had a good game plan in place, everything became much looser and easier to pass.
· Onsite content support. Developing good content, or as we called it, making vowel movements, is always a crucial part of an SEO strategy. That's why we spent some time analyzing and supporting onsite content efforts. This particular client already had a thriving (and punny) blog, but we helped advise and fine-tune the content for SEO purposes.
Our job was to optimize it with:
Market insights
Future outlook analysis
References to toilet seat upgrades
Data from a bidets market research report
Information relating to environmental benefits and health benefits
Comparisons of smart bidets, electronic bidets, and bidet toilet seats
We kept the humor but reinforced it with keyword-rich, performance-focused content.
· Onsite technical optimization. We also assisted with technical onsite optimization, analyzing internal pages for technical performance, keyword support, and more. With hundreds of ranking factors considered by Google, technical onsite optimization is hard to practice without an experienced SEO provider assisting you.
Pages focused on limited mobility, elderly population, and accessibility
This is where SEO acts as a crucial role, ensuring Google can digest everything efficiently.
· Offsite content and link building. The heart of this campaign was in offsite content and link building. Writing and publishing offsite articles with various relevant publishers helps to increase your domain authority and page authority, ultimately increasing the subjective authoritativeness of your brand and thereby increasing your rankings. his extended relevance across multiple regions including North America, Asia, and Europe. After even a few months of consistent external publishing, this bidet brand began to see positive momentum in the SERPs.
This is where things really took off.
We built a strong offsite presence using:
Outreach to industry blogs
Backlinks from bathroom fixtures publishers
Mentions alongside key companies
Thought leadership related to market landscape, deployment mode, and e commerce expansion
As authority climbed, so did rankings.
· Ongoing critical analysis. We’re not party poopers, but sometimes, it’s important to acknowledge the limitations of our own efforts. SEO is as much of an art as it is a science, and it requires some analysis and tweaking to be successful. We kept a close eye on our progress, especially in the first few months, so that we could learn from our efforts and adapt. We constantly adjusted strategy based on:
New market opportunities
Rising environmental concerns
Patterns among tech savvy consumers
Shifts in demand for heated seats, adjustable water, and adjustable water temperature
Growing interest from high end hotels and commercial buyers
Adoption trends for products like portable bidets and handheld bidets
Buyer behavior within the expanding competitive landscape
Ultimately, this allowed us to achieve much more for this bidet brand.
Like a constipated accountant who couldn’t budget, some of our clients lack the resources necessary to support a higher-level campaign. But with even a modest budget, we can offer a collection of strategies capable of helping your brand achieve sustainable SEO momentum.
The Big Splash: Our Impact
It was a splash hit from the start — flushing away any lingering doubts about our SEO strategy.
· An increase in overall ranking keywords by 10x. We were able to multiply the total number of keyword rankings for this client by a factor of 10. In other words, they rank for a number of keywords in order of magnitude larger than what they started with.
· Top 10 rankings for the bidet industry’s 5 most competitive bidet market keywords. From bottom to top, we cleaned up the rankings. This brand is now on page 1, in the top 10 rankings for all 5 of the most competitive keywords in the bidet industry.
· 300x impressions. For each impression this brand had before we started, it now has more than 300. Thousands and thousands of people are seeing this brand for the first time.
· 10x leads. With the sales pipeline officially unclogged, this brand saw a tenfold increase in leads. And we expect this is only the beginning.
· 4x sales. As you might imagine, this had a very positive impact on sales. Now, this bidet brand has 4 times as many sales as it did – and it's selling more on its website than it is on Amazon.
· Massive email list growth. As an added bonus, this bidet brand has seen massive email list growth. As more people discover and visit this brand’s website, the list continues to naturally expand.
Our client saw meaningful traction across North America, with improved visibility aligned to rising global market size.
The Streak Continues
The global bidets market will continue expanding in the coming years, especially with innovations in:
Smart bidets
Electronic bidets
Heated seats
Energy efficiency
Improved comfort
User comfort
And as North America and the Middle East show increasing momentum and contribution to the rising market size, our client’s momentum is only accelerating.
With a broader spectrum of target keywords, more onsite refinement, stronger marketing efforts, expanded product lines, and deeper regional market segmentation, and of course, more content, we expect their market share to grow even further.
Perhaps you found the humor in this article corny. Perhaps you only liked a phew of our jokes.
Whether you're in the global bidets market, exploring market trends, or simply ready to upgrade your digital presence, we can help your brand:
Reach potential buyers
Establish authority among key players
Expand into emerging markets
Improve conversions
Outrank competitors
And secure long-term, flush-worthy success
If you want a free consultation, far fewer puns, and far more impact, contact us today!
Have you ever had to manage a fleet of vehicles for business? If you’re in fleet management, you already know it’s hard work for fleet managers.
We’ve never done it personally, but we’ve become increasingly familiar with the demands of running an entire fleet of company vehicles—cars, trucks, school buses, and other fleet vehicles and equipment. Daily fleet operations depend on fleet health, vehicle health, and keeping fleet assets in top condition, without letting operational costs or maintenance costs spiral.
Maintaining a fleet of vehicles effectively requires constant attention to inspections, warranties, fuel management, fuel costs, fuel expenses, repair costs, maintenance activities, and maintenance information—all while trying to reduce costs, improve efficiency, and protect fleet efficiency and fleet uptime. Unexpected breakdowns and vehicle downtime lead to costly repairs, unexpected repairs, and higher repair costs, so preventive maintenance and preventative maintenance matter.
A good fleet maintenance software platform can help in all these respects, but it can't help you unless you know it exists. Modern fleet management software and broader software platforms give fleet managers one system with full visibility into fleet data, real time data, and all the data they need for data driven decisions. With GPS tracking, fuel tracking, fuel cards, and fuel consumption dashboards, teams get real time visibility and fuel optimization that supports fuel efficiency. Inventory management features—parts inventory, parts management, manage inventory controls, and parts usage reports—show fleet inventory status and parts usage in house and in real time. This kind of maintenance management helps prevent unexpected breakdowns, reduce downtime, and keep vehicles and equipment reliable across an unlimited number of sites.
But even the right tools can’t help you unless buyers know you exist. That was part of the problem for the fleet maintenance software company that came to us with hopes of accelerating to the top rankings in relevant search engine results pages (SERPs) for fleet management software, fleet management platforms, and the broader fleet maintenance software category..
It was our pleasure to get behind the wheel and take the fast track to greater organic traffic.
Today, they’re one of the best fleet and most visible fleet maintenance software companies on the market, ranking for fleet maintenance, preventive maintenance, and fleet management software searches that actually drive leads.
So how did we get there?
Shifting Gears in the Digital Landscape
Digital marketing is more accessible, yet harder than ever. With so many key competitors fighting for the top spots in SERPs and so many ranking factors to keep track of, it's not straightforward for a business owner to devise or implement an effective SEO strategy that speaks to fleet size, fleet assets, and maintenance management realities—especially when maintenance costs, inventory management, and fleet health are always on the line. Fleet brands need actionable insights, accurate insights, and better decision making based on real time performance.
Admittedly, it's not hard to reach rank 1 for a keyword, assuming you don't have preferences for what that keyword is. There are plenty of long-tail phrases that are unpopular and undesirable enough that even a modicum of SEO investment can put you in the top spot.
But this isn't good enough for a fleet maintenance software company that wants real leads and real sales from transportation and service decision making stakeholders.
If we were going to truly help this team of fleet maintenance professionals, we would need to adopt a much more strategic, targeted approach tied to fleet operations, preventive maintenance scheduling, and measurable maintenance management outcomes.
An 18 Month Campaign: Pedal to the Metal
We had a need for speed – a genuine desire to see results as quickly as possible.
Of course, we were somewhat limited by the nature of SEO, which requires months, and sometimes years of effort to see meaningful results.
That's why we started an 18 month campaign, so we would have plenty of time to map key features, build comprehensive reports, and continuously refine based on detailed history from analytics and Search Console.
· Strategy and keyword analysis. In the SEO world, everything starts with a strategic analysis of the fleet maintenance niche. We took a look at the fleet maintenance industry, including competitors and prioritized keywords directly tied to fleet management software, fleet management, preventive maintenance tasks, maintenance requests, and maintenance scheduling. For this campaign, we wanted to focus heavily on keywords that were directly relevant to the brand and its customers—buyers searching for platforms to reduce downtime, control maintenance costs, and avoid costly repairs in an entire fleet. There was no reason to try and achieve rankings or traffic for audiences that weren't going to be interested in buying the product.
· Technical onsite optimization. Good campaigns also rely on technical onsite optimization. We improved site speed, structured data, and mobile experience so fleet managers on a mobile app or desktop applications could easily view content with easy access, and a mobile app could support field teams. Clean architecture also ensured one platform experience for every persona, with quick access to maintenance information, work orders, and fleet data.
· Onsite content development. Strong onsite content is still an ideal foundation for any SEO campaign, as it lends itself to higher website authority, more relevant keyword optimization, and better opportunities for inbound linking. We built a robust knowledge hub around fleet maintenance, preventive maintenance, preventative maintenance, fleet inventory, inventory management, and maintenance scheduling. This made maintenance information easily accessible for prospects comparing management software for fleet vehicles while trying to reduce costs and improve efficiency.
· Offsite content and link building. Much of our work focused on establishing a more powerful superhighway leading to this client's website. We developed content featured in a wide range of different offsite publishers for this client, building links throughout the process. Those links supported better performance, saving time for the sales team, and higher rankings for fleet management software and fleet maintenance topics.
No Breakdowns: A Smooth Ride to the Top of the SERPs
No SEO campaign is without its minor hiccups and deviations. In fact, this is a critical part of the process. As we closely analyzed our own methods and our client’s performance, we were able to learn more about this unique SEO niche – and eventually deploy the tactics necessary to help this fleet maintenance software company dominate their top competitors. By monitoring what resonated with fleet managers, we found that content emphasizing real time visibility, fleet data, and maintenance management workflows performed best. We leaned into those strengths to help stakeholders stay on the same page and make better decision making a habit.
The Well-Oiled Machine
Some of the most impressive results of our efforts include:
· Exclusively relevant keywords. Some brands can afford to target general audiences. But most people aren't business owners, and most business owners don't have a fleet of vehicles to maintain and manage. Accordingly, we knew we needed to be as specific and highly relevant as possible in our optimization campaign. We targeted relevant keywords tied to fleet management almost exclusively, prioritizing and highlighting only the keywords most likely to result in sales. We aligned content so stakeholders were on the same page about ROI, maintenance costs, inventory management, and maintenance scheduling.
· 2.5x increase in organic traffic. As a result of our combined SEO tuning efforts, we were able to provide this client with a 2.5-fold increase in organic traffic. In other words, this client is now seeing two and a half times as much traffic from search engines as they were before this campaign started. And because we exclusively targeted relevant fleet maintenance and preventive maintenance keywords, we can be reasonably assured that this traffic is chock full of qualified leads and potential buyers.
· 3x increase in total ranking keywords. We were able to multiply the number of total ranking keywords for this client by a factor of three. They're now appearing in searches for three times as many keywords and phrases, covering everything from preventive maintenance to fuel tracking, fuel consumption, and fuel optimization. Almost any relevant search for this type of product will feature this brand.
· 4x increase in ranking keywords in positions 1-4. Visibility can be a tricky thing in SEO, as high rankings are disproportionately valuable. For this fleet maintenance software company, we were able to achieve a four-fold increase in ranking keywords in positions 1-4. Positions 1-4 represent roughly the top half of the first page – and websites in these positions receive the lion’s share of the traffic for a given query. We achieved a four-fold surge in top placements for high-intent fleet management software and fleet maintenance software terms. Those rankings drove more work orders requests, more work orders demos, more work orders-related feature exploration, and more work orders tied to maintenance management needs.
Along the way we showcased how the product supports work orders, track work orders, work order management, a work order system, and automated maintenance. We highlighted how work orders reduce downtime by surfacing potential issues early—before small issues become expensive problems. Prospects could easily view work orders, maintenance tasks, and preventive maintenance tasks in real time, with data entry kept simple and data entry workflows streamlined. That clarity helps fleet managers make data driven choices with actionable insights, provide insights to leadership, and keep fleet assets healthier for longer—without runaway maintenance costs or unexpected repairs.
Are you ready to hit the road and leave your competitors in the dust?
Are you looking for only the best results for only the most relevant target keywords in your industry?
With the rapid advancements of technology in the financial advisory sector, modern financial advisors rely on digital platforms to deliver personalized financial advice at scale. Customer relationship management (CRM) integrations have become practically indispensable in a thriving financial advisory practice, helping advisors build stronger client relationships, improve client engagement, and maintain accurate records of every stage of the client journey. A well-designed CRM for financial advisors also reduces administrative burden, supports team collaboration, and helps streamline operations across day-to-day business operations.
A trusted customer relationship management platform allows financial advisors to organize information about their client base, client portfolios, goals, and life stages so they can provide timely service and tailored recommendations. From tracking client interactions to logging a complete communication history, CRMs support deeper client interactions, better client experience, and more consistent client follow ups.
At the same time, there is also the added responsibility of ensuring thorough security measures are put into place to protect sensitive client information from unwanted exposure. Wealth management firms and other financial institutions must comply with industry-wide security regulations driven by consumer expectations and regulator oversight. This makes security compliance a non-negotiable requirement when selecting CRM solutions, especially when using platforms with broad integration capabilities and automation capabilities.
Firms must abide by specific industry-wide security regulations designed out of consumer demand for such protection, making security compliance in CRM systems essential for successful operation within this sector.
This article will explore how financial advisors can ensure regulatory compliance while using a best CRM for financial professionals—whether they choose salesforce CRM, salesforce financial services cloud, or alternatives such as Zoho CRM—to manage client relationships and protect privacy.
Security Regulations for Financial Advisors
Financial advisors working in financial services operate under strict rules designed to prevent, detect, and respond to unauthorized access or misuse of confidential information. These industry-specific regulations are designed to ensure a secure environment that prevents, detects and responds to incidents related to unauthorized access or misuse of confidential information.
Regulations typically require:
Strong security governance and compliance management
Controls around access, storage, and transmission of sensitive financial data
Ongoing auditing and incident response readiness
Evidence that third-party tools meet the same standards as internal platforms
Advisors must take additional measures by meeting regulatory requirements when leveraging third-party applications such as CRM systems. Because CRM for financial advisors often connects to other financial tools—including portfolio management tools, financial planning software, and portfolio management platforms—each integration must be reviewed to ensure security and data consistency across systems. Firms should perform due diligence before adopting any new tool, especially for integration capabilities that integrate data across multiple sources.
When implementing security measures in CRM for financial advisors, data encryption and secure storage practices are essential steps. All confidential client information needs to be encrypted both at rest (in databases, files, etc.) and in motion (during transmission). In addition, ensuring the secure storage of this sensitive data is vital. This is essential for maintaining compliant handling of financial documents and other sensitive records.
Businesses should take adequate precautions to protect their servers against malicious actors seeking unauthorized access by using firewalls and other defensive solutions such as network segmentation or role-based authentication mechanisms. Multi-factor authentication, credential rotation, and secure contact management practices reduce the risk of account compromise. Strong protections matter even more when advisors use mobile access, a client portal, or cloud platforms such as salesforce financial services cloud.
Monitoring system activities on a regular basis can reveal any suspicious events that might indicate an attempted breach. The use of credential rotations and multi-factor authentication also stands to harden these defenses against possible threats.
Access control and user authentication methods
Access control is a core compliance expectation for any customer relationship management platform. Access control mechanisms like role-based or attribute-based permissions limit the scope of system activities that each user can perform within a service or application.
User credential authentications limit access based on user identity, roles and attributes through local authorities such as directory services and single sign-on providers.
Systems should require complex passwords with two-factor authentication and monitor automated login attempts, potentially blocking them completely if needed. Installing rate limits helps manage unexpected burst loads from malicious bots attempting to gain unauthorized login information. Additionally, policies ensuring test production environment segregation help avoid security lapses that arise from administrator errors.
Best practices include:
Complex passwords plus MFA
Rate limits to prevent bot attacks
Monitoring of failed login attempts
Policies to protect unique business processes and internal workflows
These safeguards not only meet security requirements but also support operational efficiency and safer workflow automation.
Regular monitoring and auditing of system activities
Regulators expect ongoing monitoring, not a one-time setup. Advisory firms should audit usage logs to detect suspicious behavior and verify that CRM for financial advisors is being used properly. Automated tools can test encrypted transactions and simulate incidents.
Regular monitoring and auditing of systems will help monitor any suspicious activity, identify potential patterns in client behaviors which may indicate a breach, validate the integrity of stored financial data, ensure firewalls and other security tools remain secure against malicious attacks, maintain detailed records for regulators, as well as analyze user credentials for timely updates or revocations.
Additionally, automated programs can be systematized for testing the reliability of encrypted transactions entered into the CRM database that must exceed both national and industry standards established to safeguard sensitive information. It can also simulate cybersecurity events that might otherwise go unrecognized simply because time leaves organizations vulnerable without preventive protocols committed.
It is essential for financial advisors to ensure compliance with client data protection in their CRM systems. A crucial component of this process is putting in place robust privacy policies and consent management practices. A compliant CRM for financial advisors must allow advisors to clearly document consent and ensure clients understand how their information is collected, stored, used, or shared. Firms should implement robust privacy policies and make revoking consent easy through a website process, direct email, or inside a client portal.
Financial advisors must make sure that clients fully understand the collection, storage, usage, sharing or retention of their personal information and grant the necessary consent before proceeding with any activities related to such data processing.
These explicit client consent should be documented properly and financial advisors also need to ensure they are able to revoke and update such consent through accessible website functions or an easily contactable member of the team. Regular monitoring should also occur to ensure complete adherence to these practices in order to preserve their reputation as a trustworthy advisor user data.
Keeping consent records updated supports client relationship management, enhances trust, and helps improve client relationships over time.
Secure data transmission and communication protocols
Ensuring compliance with client data protection is an important part of securing CRMs for financial advisors. Technology that enables secure data transmission and communication protocols brings additional layers of security to protect confidential information from outside sources or malicious actors who would use it for unsavory purposes.
Secure communication channels such as TLS can encrypt in-transit traffic, while authentication and authorization methods like OAuth or OpenID Connect will help verify the legitimacy of users trying to access a system and enforce conditional access rules accordingly.
For larger wealth management and enterprise financial services firms, centralized IAM supports secure access across departments and reduces gaps formed by disconnected tools.
Incident response and breach notification procedures
When it comes to client data protection in CRM systems for financial advisors, incident response and breach notification procedures should be of the utmost importance. Financial advosirs must have policies and plans in place to quickly detect, investigate, assess, contain, mitigate, and remedy security incidents or data breaches.
This includes having contacts available who are knowledgeable to help guide an organization through the conduct of any investigation dissemination within regulatory guidelines. It is also important that compliance officers are well-informed about incident response processes for mitigation purposes.
Any remaining susceptible information or protocols should also be taken into account coordinating a timely local and/or global notification before any kind of sensitive information becomes compromised.
Choosing the Right CRM for Financial Advisors
Selecting the right CRM means balancing security, usability, and advisor-specific functionality. A leading software review site can help compare options, but firms should also conduct internal assessments based on their compliance needs and workflows.
Key evaluation points:
Security & compliance features for regulated financial services
Support for portfolio management tools and financial planning workflows
Strength in client engagement and client management
Reliable integration capabilities with financial tools
Reporting with valuable insights, data insights, and gain insights capabilities
Ease of adoption, including vendor-provided training resources
Platforms such as salesforce CRM and salesforce financial services cloud are popular for firms that need deep advisory functionality and robust compliance controls. Meanwhile, Zoho CRM can be a solid fit for teams seeking flexible customization and affordable scaling.
Importance of educating advisors on security best practices
Training and education on security best practices is essential for advisors in the financial industry leveraging CRM systems. Advisors must remain educated on the applicable security regulations and have a comprehensive understanding of data protection policies.
Training should cover topics such as updating authenticators, avoiding untrusted links, compliance requirements for handling client data, utilizing secure passwords and storage measures, avoiding public networks, potential breach notification duties and procedures that needs to be followed, etc.
Training should emphasize responsibility towards making sure clients' interests are met by following the updated security guidelines at all times.
Providing ongoing training to enhance security awareness
Providing ongoing training is an essential part of ensuring security compliance in CRM systems for financial advisors.
Training should be designed to enhance the overall security awareness levels of staff and emphasize specific security requirements applicable to their job roles, including system access control procedures and secure storage practices.
Financial advisors should also receive regular updates as regulations evolve over time, so their knowledge stays up-to-date with industry standards.
Creating a culture of security compliance within the organization
The key to fostering a culture of security compliance lies in training and educating financial advisors about the importance of following industry-specific confidentiality regulations. Training must go beyond merely giving theoretical concepts, by articulating how data protection plays out for practice management tools like CRM systems. Ongoing education will ensure that employees understand the organization’s key security policies and protocols and equip them with the skills needed to implement appropriate controls.
Conclusion
In conclusion, a secure CRM for financial advisors is essential for compliance and long-term success.
Ensuring adherence to security guidelines requires an active involvement from advisor organizations including the adoption of secure data storage, access control, and Privacy policies as well as user training and education on cyber threats. At the same time, CRMs help advisors grow by improving client relationships, enabling stronger client engagement, and powering insights through advanced analytics.
Regular monitoring needs to be implemented along with incident communications procedures in case of any suspicious activities otherwise the risks related to Data leakage or breaches could inflict serious damages both financially and reputationally. Ultimately advisors must recognize that they have a responsibility to continually safeguard their client's confidential information.
Whether using Salesforce financial services cloud, Salesforce CRM, or Zoho CRM, financial advisors should prioritize platforms that support compliance, strengthen relationships, and improve efficiency through automation. Done right, the CRM becomes not just a database, but a strategic engine for better service, smarter decisions, and durable trust in financial services.
There are many platforms for taking your content and publishing it to increase its visibility and reach a broader audience.
In addition to marketing your content through email newsletters, guest posts on external blogs, and submissions via social bookmarking sites, the real power lies in creating a LinkedIn content strategy that aligns with your overall content strategy and business goals.
Before diving in, here’s a brief description of why LinkedIn stands apart from every other social network: it blends professionalism, credibility, and visibility like no other social platform, making it a key tool for increasing brand awareness and relationship building.
The variety and sheer scope of social media platforms today make it, as a whole, the most potentially impactful avenue for content promotion and syndication. Unfortunately, many content marketers have resorted to using it only for the simplest purposes: posting a link to a new post when it goes up, and nothing else.
While some social networks lend themselves to this style of promotion, you’re doing yourself a disservice if this is the only way you leverage social media. Too many social platforms offer too many benefits to be ignored, and some platforms, like LinkedIn, are shockingly underutilized in the content marketing strategy game. Because of this, there is a critical competitive opening, and if you use it efficiently, LinkedIn marketing can be your secret weapon in your content marketing campaign.
To truly enhance your LinkedIn content marketing strategy, focus on creating and sharing quality content that resonates with your target audience. By developing an intentional approach to LinkedIn content creation, you can not only build credibility and build awareness but also drive traffic, connect with decision makers, and strengthen your professional network. This guide explores how to transform your LinkedIn presence into a content marketing powerhouse.
One Platform, Many Outlets
Unlike other social platforms, the greatest power of LinkedIn is its ability to offer multiple connection mediums within one collective umbrella. By comparison, Twitter only offers two types of posts: tweets and direct messages, while Facebook offers three: timeline posts, posts on a friend’s or brand’s timeline, and messages to a friend or brand.
LinkedIn offers far more options for sharing and submitting content. You can share LinkedIn posts on your own profile, similar to Facebook’s individual timeline, post on behalf of a company, share LinkedIn articles with another individual in the form of a message, share long form content, post document posts, host live stream sessions, or even run sponsored content and LinkedIn ads.
This diversified landscape of opportunities enable a flexible LinkedIn content marketing strategy tailored to your ideal audience. For example, business owners can post thought pieces, share company updates, or distribute valuable information to reach a professional audience that reflect their brand values.
Having the power to adjust a piece’s visibility based on its context allows you to maximize its potential impact. This immediately makes your content more powerful than if it was simply shared out in one place no matter what type of content it is. You can share PDF files or Word files as visually appealing downloads to enhance engagement. Consider using Google Analytics and your content calendar to measure performance and refine your posting schedule. Understanding which LinkedIn content types—long form posts, video content, or curated content—drive audience engagement helps you continually optimize your content distribution for maximum results.
When you create quality content on LinkedIn, you can leverage the platform's diverse sharing options to nurture and generate leads, and build stronger relationships. Effective content creation on LinkedIn not only engages your target audience but also improves your visibility on search engines. In strategically posting a blog post or article, you can enhance your LinkedIn marketing efforts, ensuring your content reaches the most relevant and impactful channels.
Leveraging a Personal Brand
LinkedIn is also the perfect place to build and leverage a personal brand. Rather than relying solely on a corporate LinkedIn page, sharing from your personal LinkedIn profile helps humanize your message. People tend to engage more with individuals than with companies, which makes regularly posting and creating content under your name incredibly effective.
You can do this by posting regularly in specific communities, building a reputation, and sharing your own individual opinions on news events and others’ articles.
A strong personal presence also supports leadership. By sharing interesting articles, in depth content, and your own perspectives on latest industry news, you can position yourself as a trusted thought leader.
Incorporating video content, PowerPoint presentations, or text ads that highlight your key benefits can further reinforce credibility. Add success stories or insights from customers to demonstrate authenticity and connect emotionally with your targeted audience. You can even share videos that tell a short life lesson or feature industry experts discussing relevant topics to further build credibility.
The Niche Power of Groups
LinkedIn Groups are one of LinkedIn’s greatest strengths. Organized by individual LinkedIn members, these sub-groups range from general to highly specific, with different sized audiences accordingly. For example, there’s a “social media marketing” group with more than one million members, but a much more specific “electrical and lighting product marketing” group with just over 20,000 members.
Chances are, there’s at least one LinkedIn Group highly relevant to your industry and your target audience at once, and several hundred other related groups to various other aspects of your business. Engaging in niche communities allows you to reach a particular audience who actively seeks informative content relevant to your industry.
Participating in LinkedIn Groups can can also open opportunities for research studies or collaborations with industry experts. By engaging in discussions and sharing valuable insights, you can drive more traffic and qualified leads to your LinkedIn company page and strengthen your brand presence. Effective LinkedIn content marketing within these groups can lead to increased visibility and credibility within your industry and target audience. The more active you are, the more likely you are to build relationships.
A strong LinkedIn strategy involves publishing content that sparks dialogue, includes thought provoking quotes, and uses sponsored content to extend reach. Providing valuable content within these communities demonstrates expertise, earning trust within smaller networks before expanding to a wider audience.
Getting Access to Influencers
Influencers, thought leaders, and business decision makers are abundant on LinkedIn. You can pick these individuals out because they’re constantly getting involved in discussions, they’re often being asked for their opinions on specific matters, and they have large numbers of connections. These members tend to be involved in other social networks as well, and they tend to command a broader social audience.
A smart LinkedIn content strategy includes connecting with these influencers by sharing and commenting on their LinkedIn content, contributing to posts, joining their live stream sessions, or collaborating on content.
Using LinkedIn ads, video ads, or document posts can boost the reach of influencer partnerships and support your lead generation and generating leads objectives. This engagement helps you build credibility, generate leads, and eventually convert these relationships into potential customers.
Targeting Your Audience on LinkedIn
By making new individual LinkedIn connections and witnessing ongoing discussions in Groups and forums, you’ll have a critical opportunity to learn how your audience operates. Through audience research tools and analytics, you’ll easily find new ideas for content topics, evaluate how people react to your currently syndicated content, and can tailor your LinkedIn content strategy based on job titles, company size, and interests.
Use these insights to guide your content strategy, refining messages for leaders and ensuring your voice resonates with your ideal customers.
Driving users from your LinkedIn profile to your landing page on your website LinkedIn can support lead generation, nurture leads and existing customers, and attract new customers and qualified leads.
Showcasing your company culture, offering helpful tools, and providing relevant information keeps your audience engaged and builds brand awareness. The goal is to use your profiles to create an ecosystem that guides users through every stage of the buyer journey—from awareness to conversion. Use an editorial calendar to organize these marketing activities consistently.
Include a clear call to action in every post—whether it’s to visit your blog or follow for fresh content—to ensure you rank higher in search results.
Aligning LinkedIn with Broader Marketing Goals
A successful LinkedIn content strategy doesn’t exist in isolation—it’s part of your overall content strategy. Align your LinkedIn presence with your marketing objectives, blog updates, and other social channels for consistency.
Highlight customer success stories, industry achievements, or thought leadership pieces that reinforce your credibility and build brand awareness. Sharing relevant content and long form posts that address your audience’s challenges builds authority and trust.
Remember: your LinkedIn strategy should not only focus on visibility but also on relationship building, generating leads, and positioning your brand as a reliable source of industry news. As an editor’s note, consider repurposing LinkedIn content into newsletters or blog series to maintain a stream of fresh content that sustains engagement.
Key Takeaways
Create quality content that aligns with your LinkedIn content strategy and supports your business goals.
Use LinkedIn Live and document posts to drive traffic and nurture potential leads.
Maintain a consistent content calendar to keep your activities on track.
Incorporate video content, research studies, and thought provoking quotes to build credibility.
Leverage LinkedIn profiles and LinkedIn pages to connect with industry experts, business leaders, and ideal customers.
Always include a strong call to action to guide readers from LinkedIn to your website.
Conclusion
LinkedIn remains one of the major social networks for professionals, yet it’s still underutilized in content marketing. With a clear LinkedIn content strategy, consistent relationship building, and a focus on increasing brand awareness, you can transform LinkedIn into a long-term driver of leads, thought leadership, and business success.


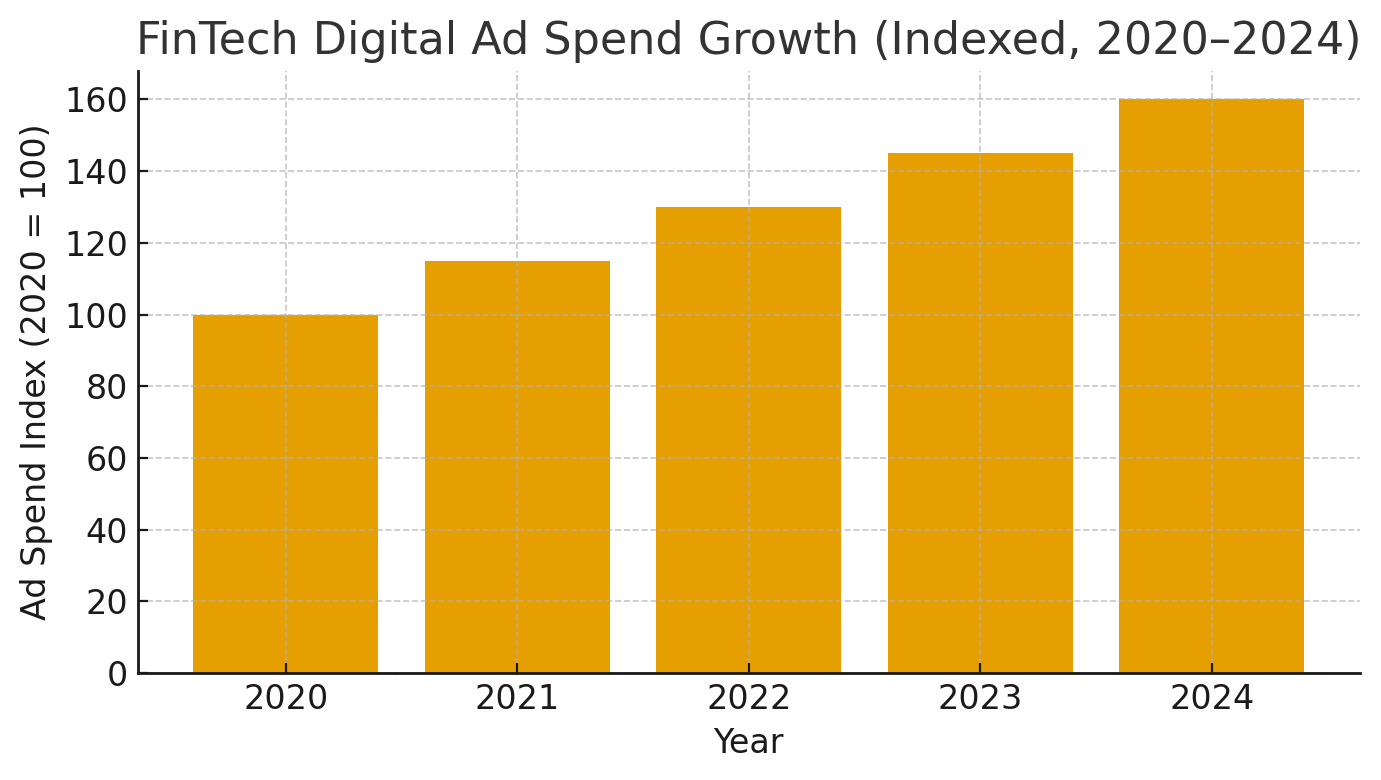

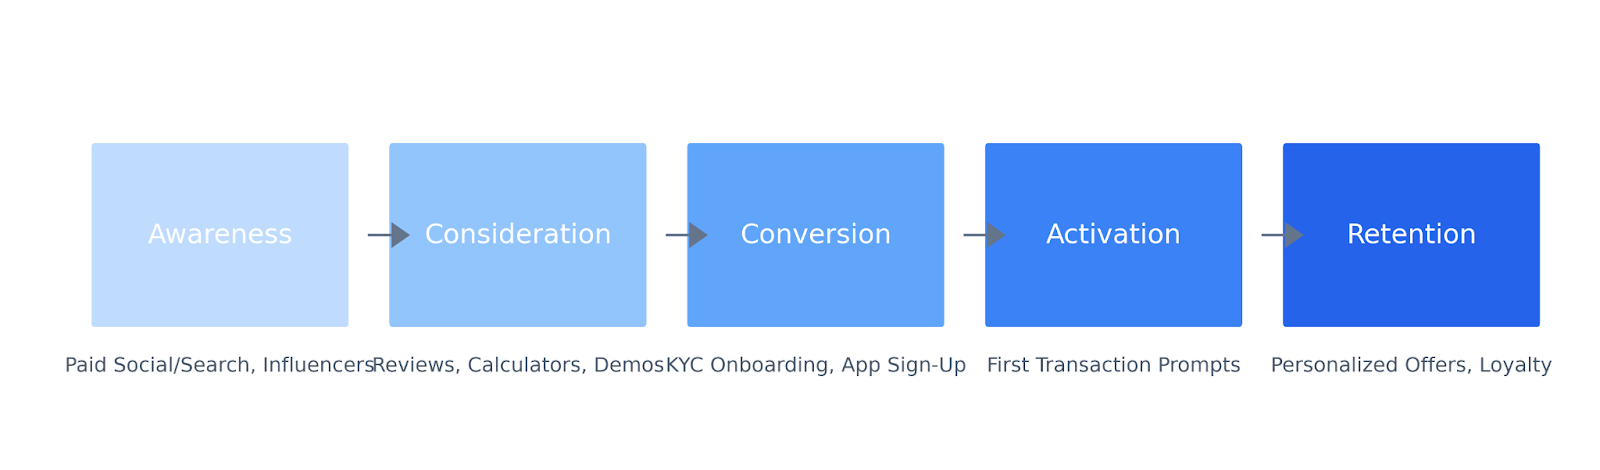
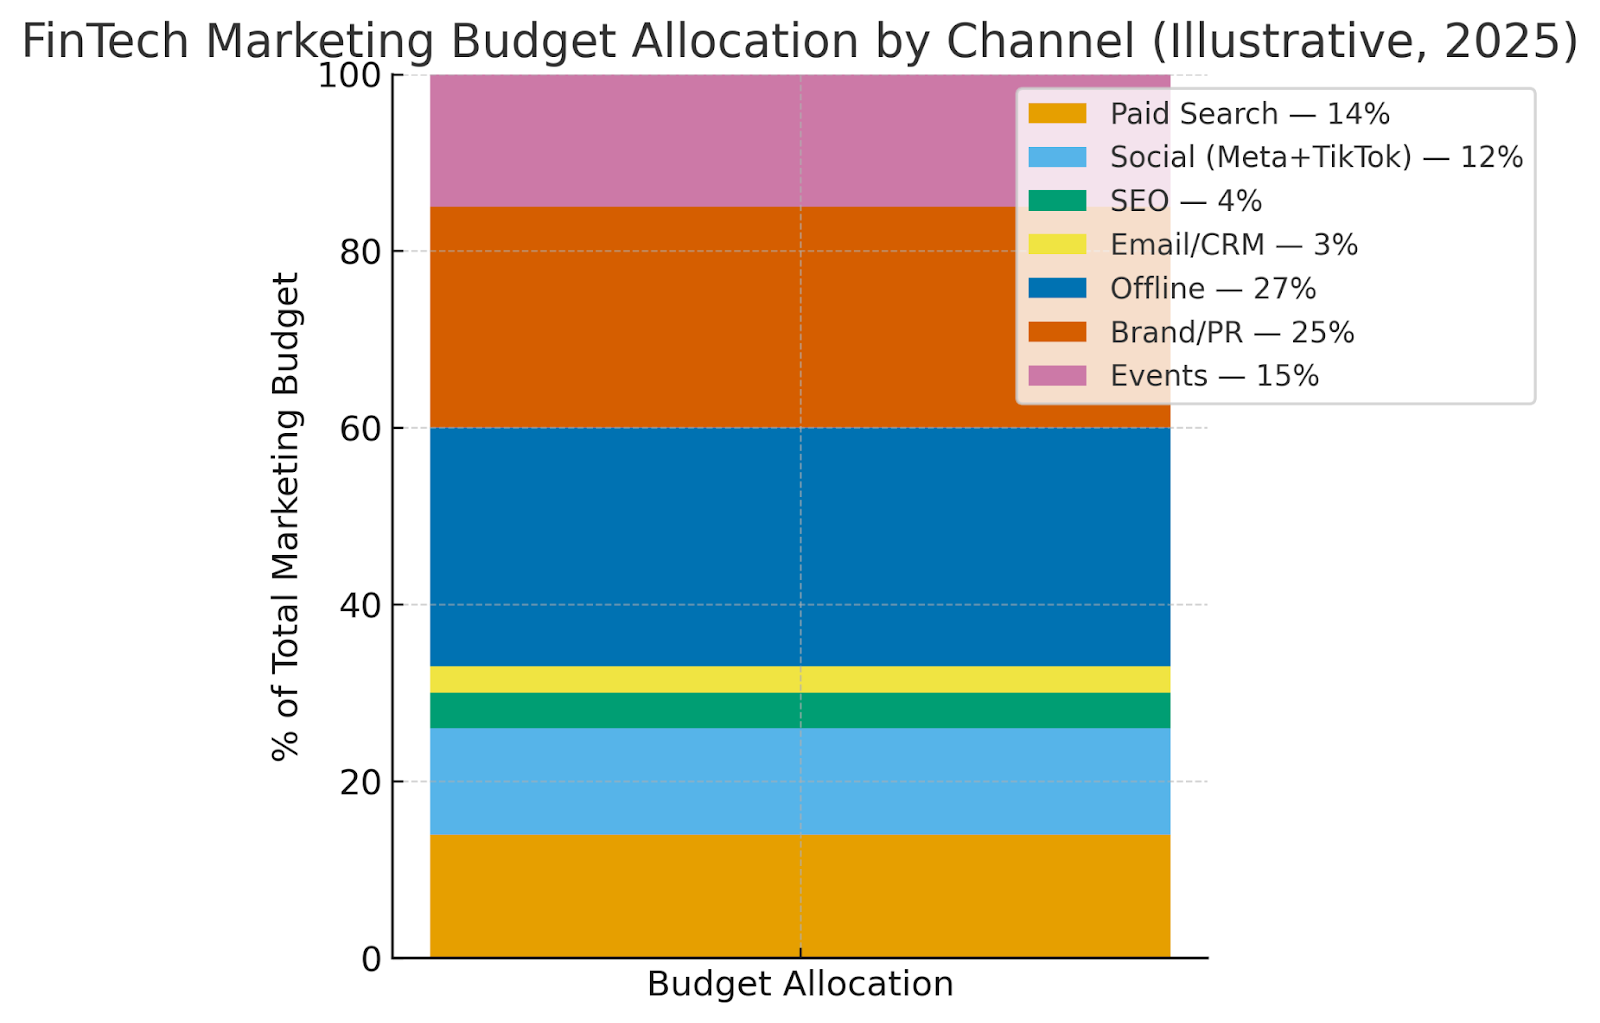
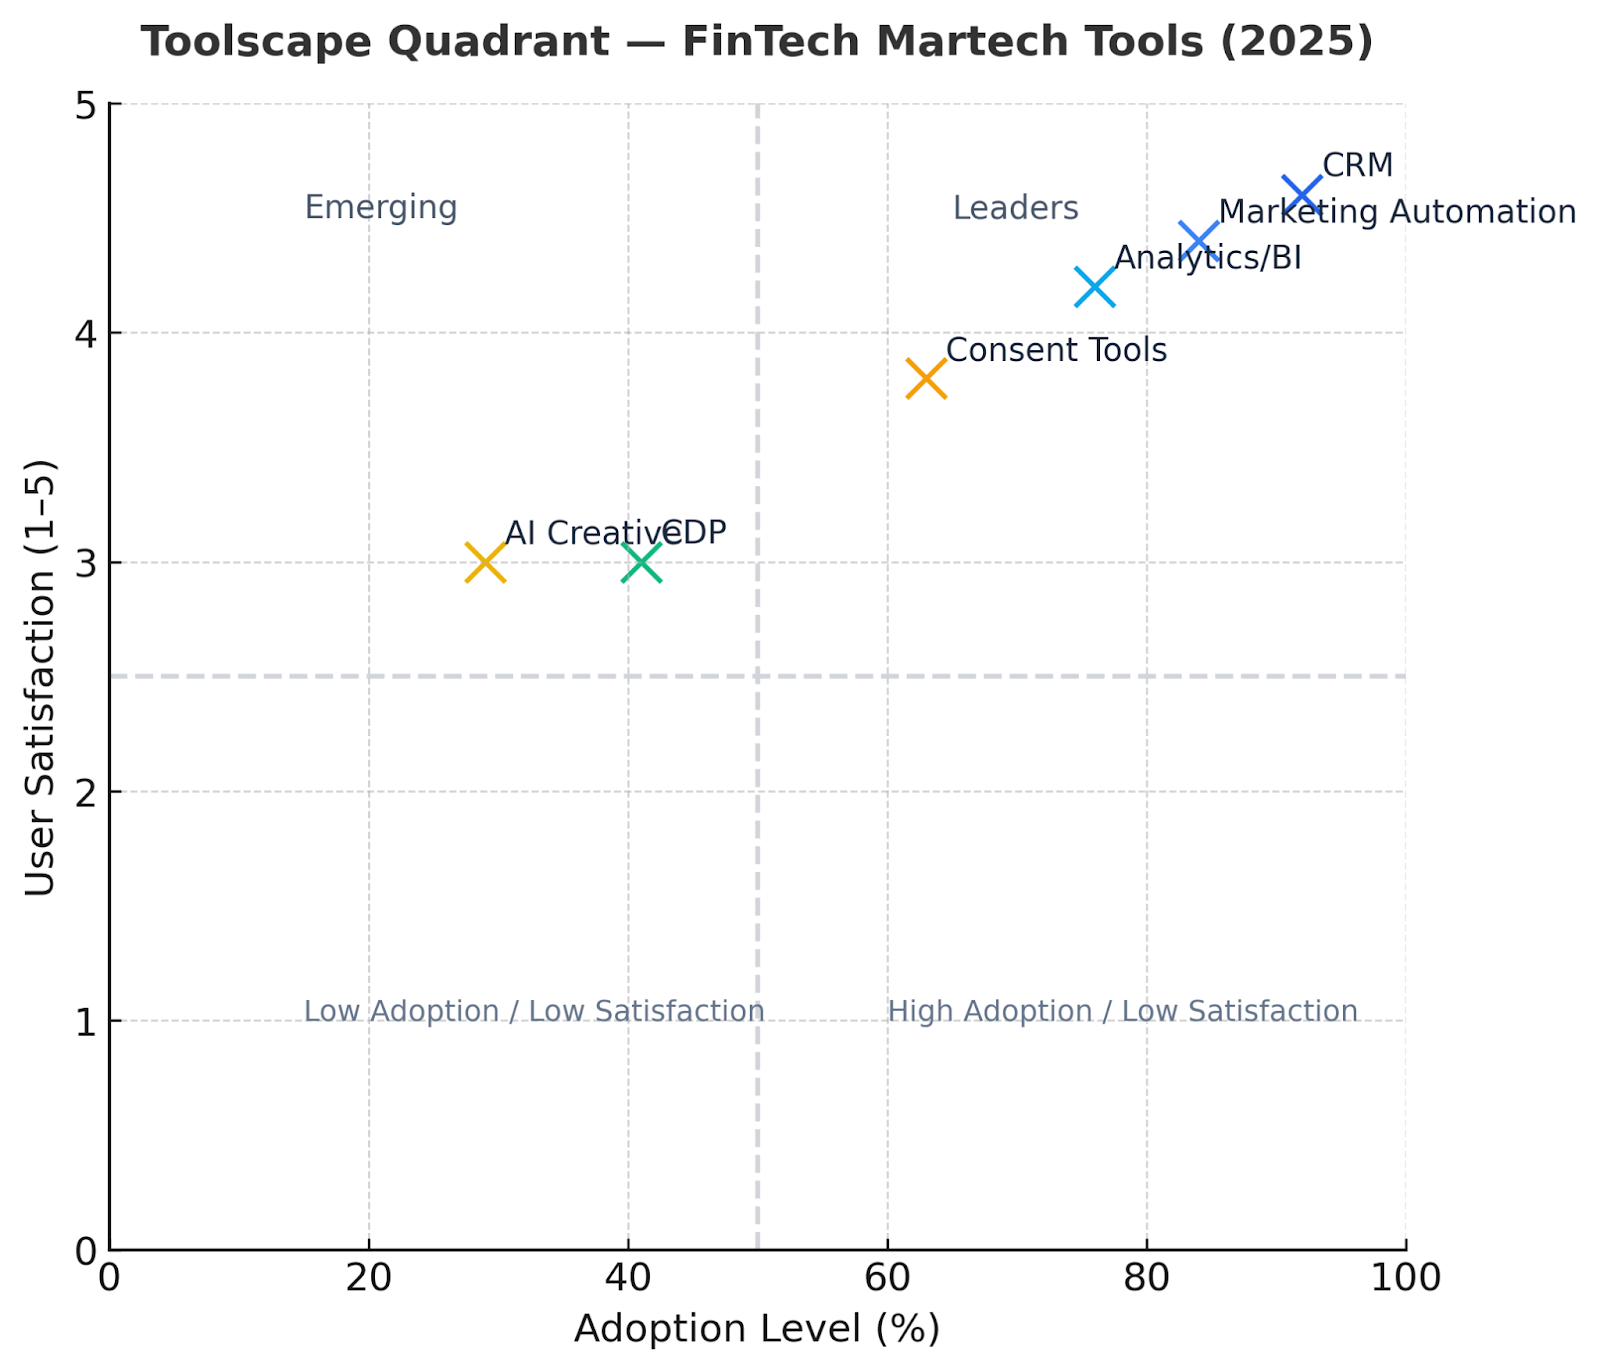

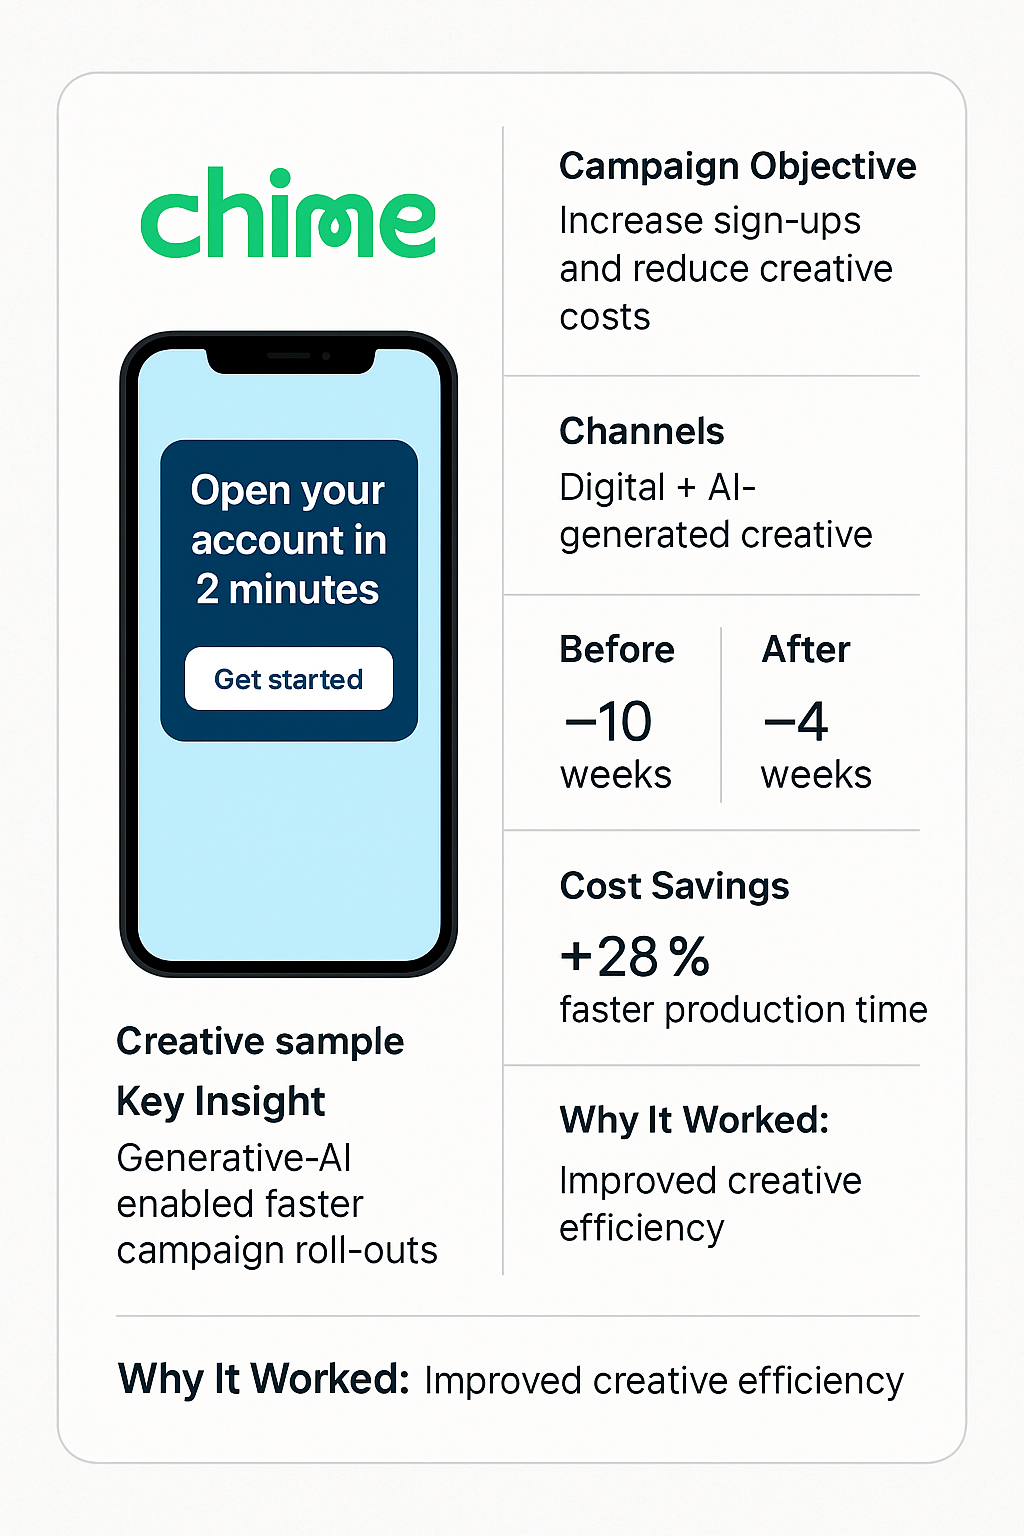

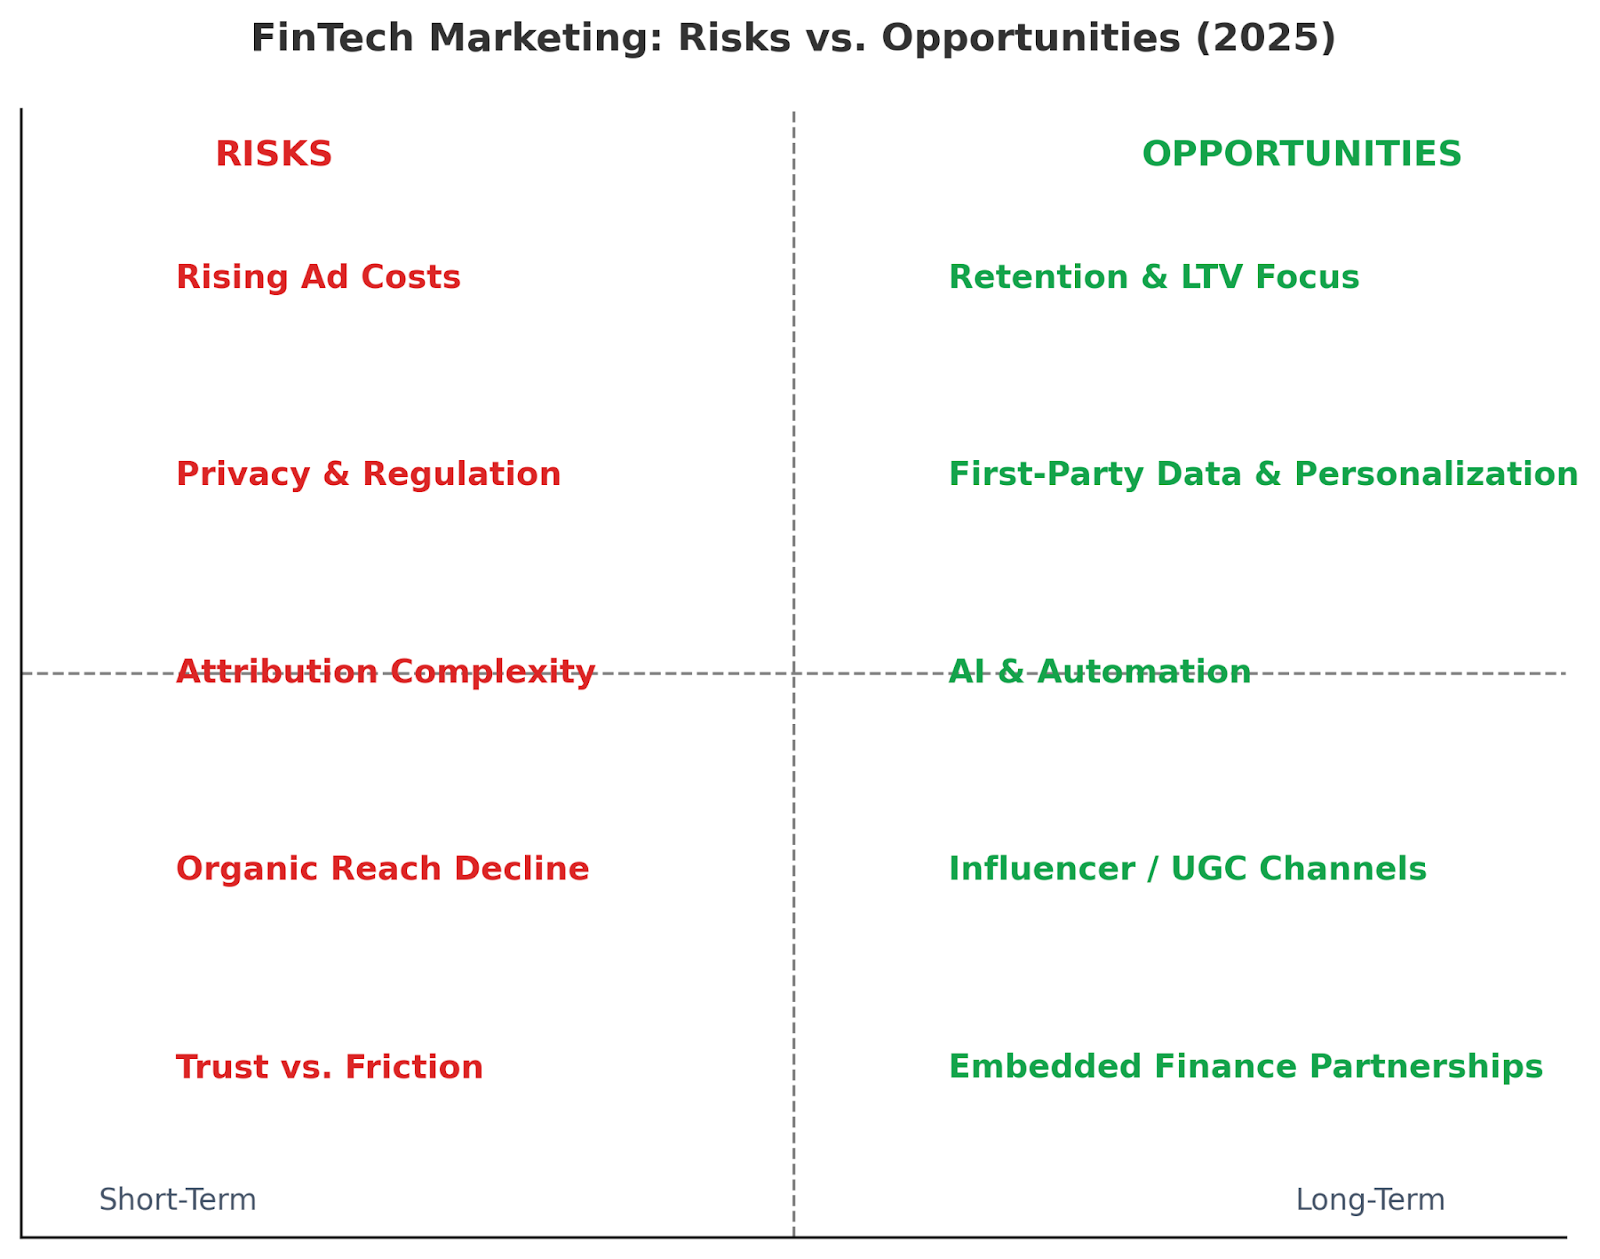
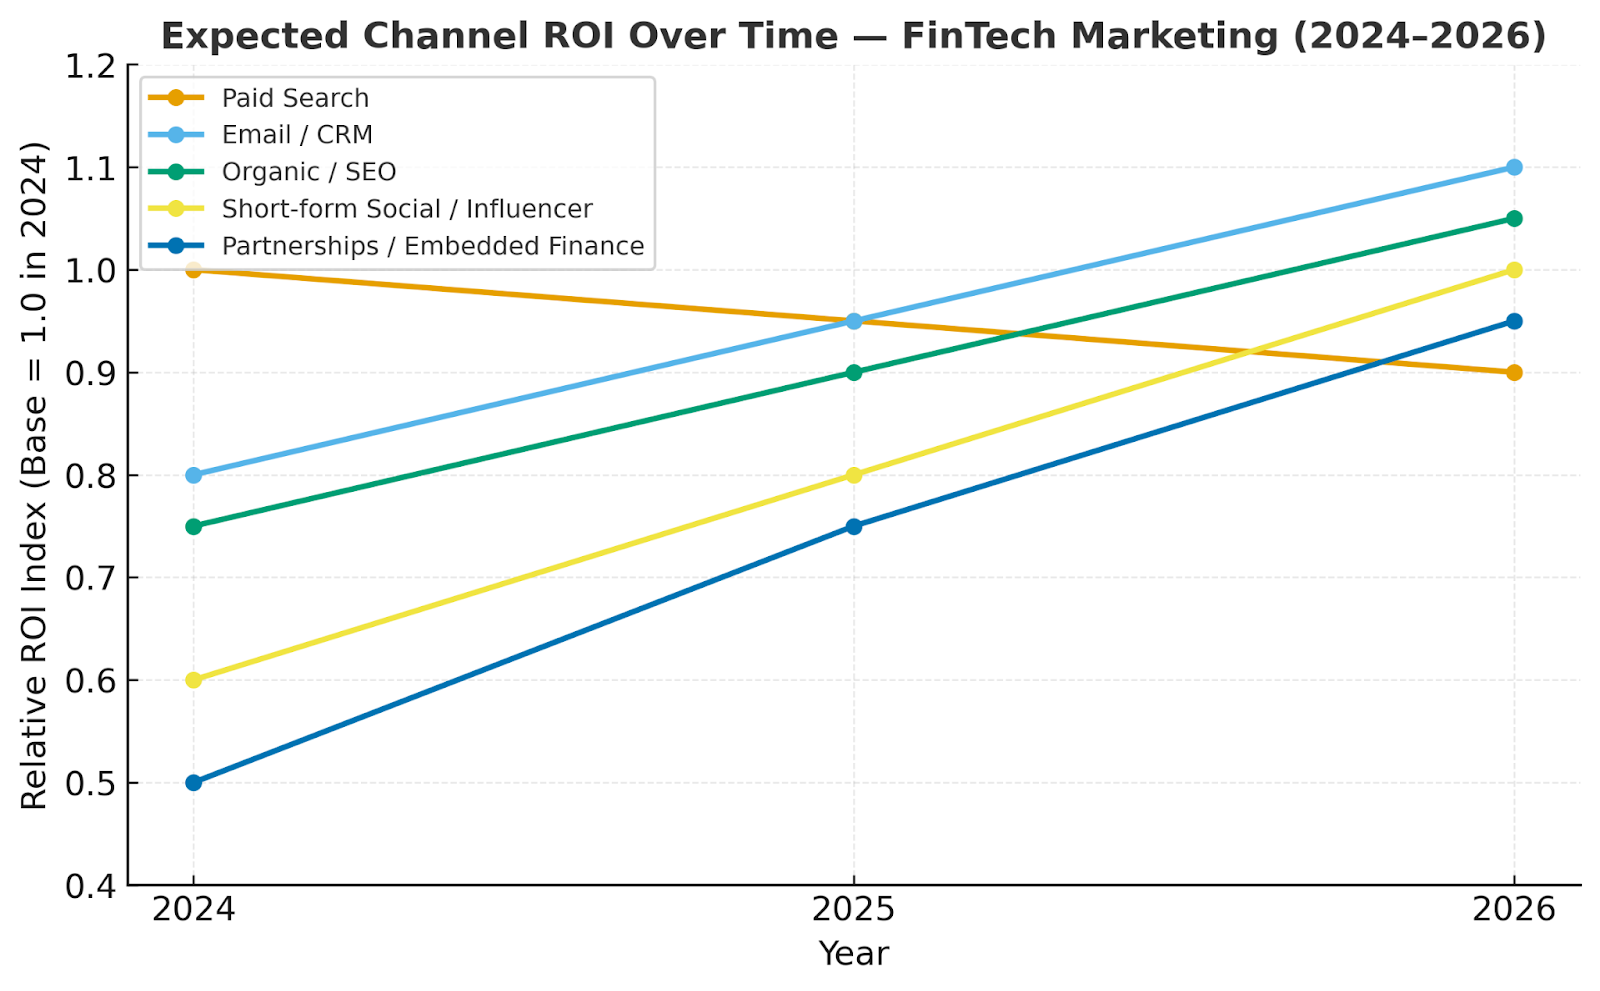
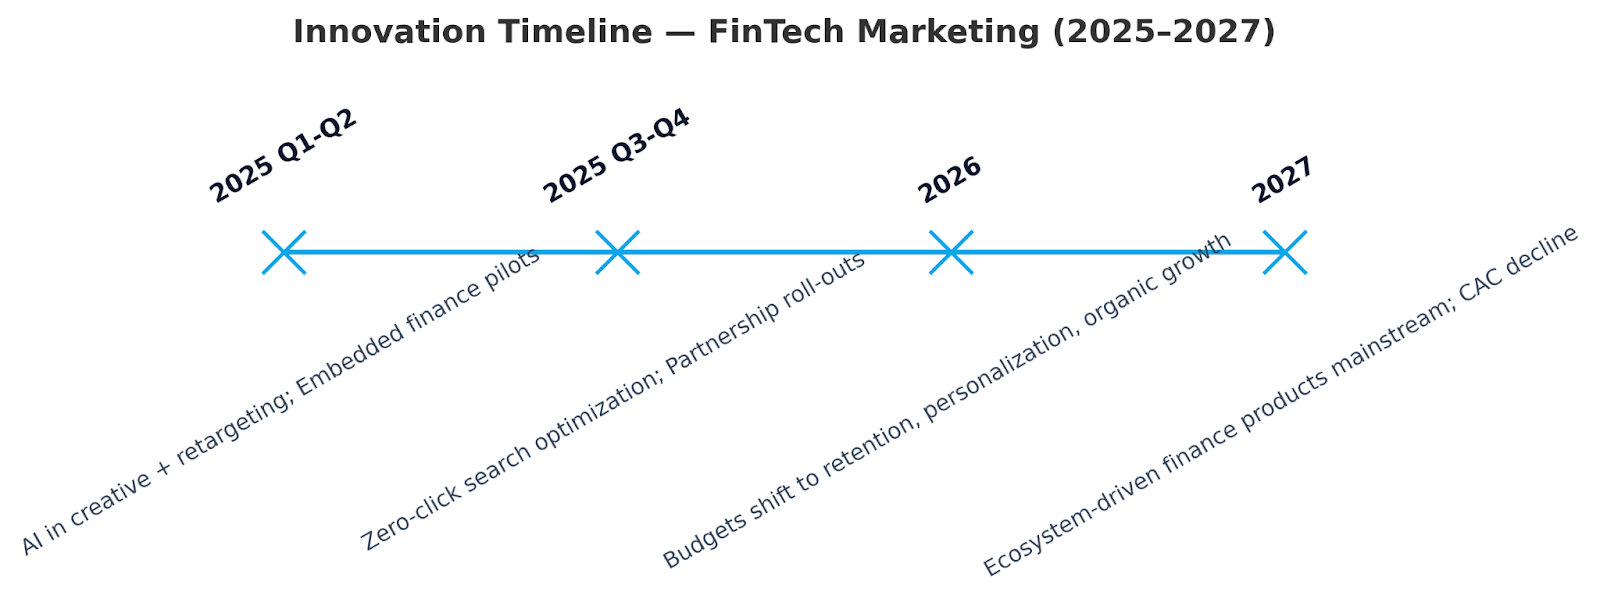


.svg)


