The Only B2B Marketing Metrics That Actually Matter
Timothy Carter
|
October 21, 2025
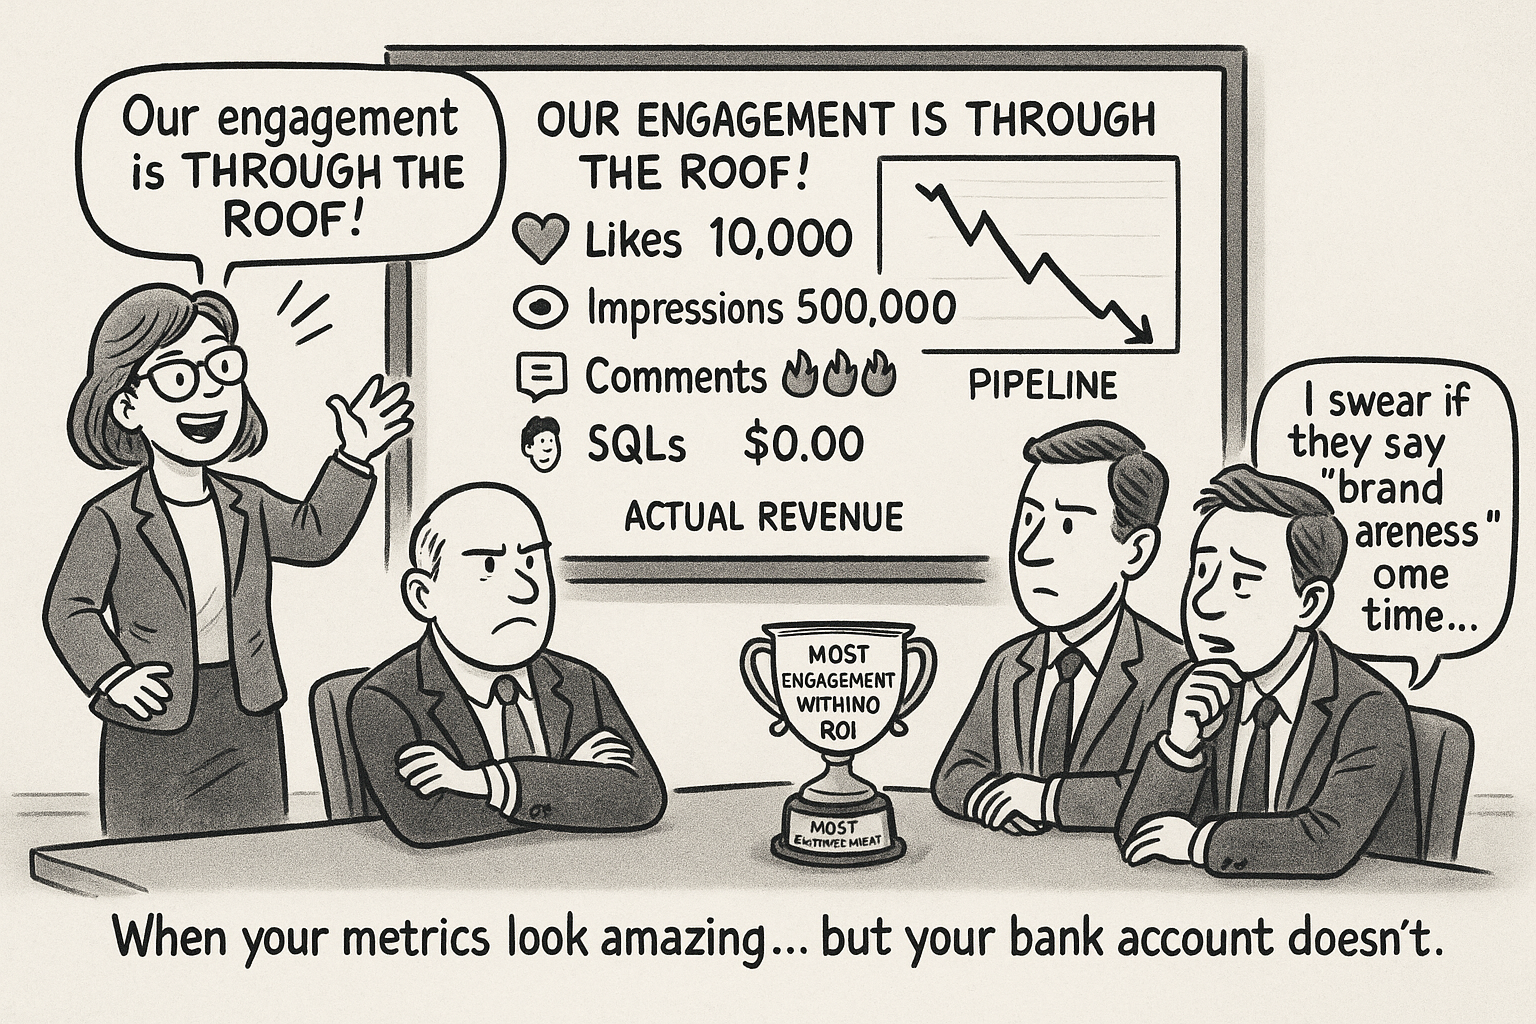
Digital marketing dashboards are cluttered with metrics that look impressive—until you try to tie them to actual revenue.
And in B2B, where sales cycles are long, buyers are scarce, and deal values are high, chasing vanity metrics isn’t just unhelpful—it’s dangerous.
B2B marketers aren’t just selling to one person with a credit card.
They’re selling to committees, procurement teams, and decision-makers who read whitepapers in their spare time.
That means every digital marketing activity needs to be laser-focused on generating pipeline and accelerating deals—not just getting eyeballs.
This post cuts through the noise to spotlight the B2B digital marketing metrics that actually matter—the ones that drive pipeline and reveal digital marketing’s true ROI.
Whether you're in IT/software/SaaS, enterprise services, or complex consulting, these are the KPIs you should care about if you're serious about scaling your marketing strategy.
Forget the fluff. Let’s focus on what really moves the needle.
TL;DR
Most B2B marketers are drowning in data—and still can't prove ROI.
Here’s what you should be tracking within your org if you want to drive real pipeline and revenue:
Sales-Qualified Leads (SQLs) – Not just leads, but qualified leads your sales team actually wants.
Cost per Opportunity – How much are you paying to generate a real sales pipeline?
Marketing-Sourced Revenue – The KPI your CFO actually cares about.
Lead-to-Close Velocity – Time kills all deals. Speed matters.
Channel-Specific ROI – Know which marketing efforts pull their weight (and which don’t).
Account Engagement – Especially in ABM, this tells you if your ICP is even paying attention.
Scrub out the vanity. Track what moves deals forward.
The Problem with Vanity Metrics
It's a blunt truth: most digital marketing dashboards are stuffed with junk metrics.
Sure, your last LinkedIn post got 1,000 impressions.
Your email had a 35% open rate.
Your blog traffic doubled last month.
But here's the real question: Did any of that generate sales pipeline?
In B2B, where sales cycles are long and buyers rarely impulse-purchase enterprise software, vanity metrics are dangerous.
Vanity metrics help marketers feel busy.
They look great in slide decks.
But they often have zero correlation with revenue.
Here are a few usual suspects:
Pageviews – A spike in traffic looks great… until you realize 80% of it bounced in under 10 seconds.
Impressions – The equivalent of someone glancing at your billboard while driving 80 MPH.
Social Likes & Shares – Encouraging, but meaningless unless the people liking your post sign contracts.
Email Open Rates – Apple Mail privacy changes just made this one even more unreliable.
Click-Through Rate (CTR) – High CTR doesn’t always mean quality traffic (especially if the landing page isn’t converting).
Vanity metrics distract marketers from the real goal: generating and accelerating revenue.
Worse, they can create a false sense of success that leads to bloated budgets, misallocated resources, and misaligned marketing-sales relationships.
You’re not in B2C.
This isn’t about volume—it’s about precision.
You should be using a rifle and not a shotgun.
One CMO at your target account is worth more than 10,000 anonymous clicks.
It’s time to stop measuring noise and start measuring impact.
B2B Digital Marketing Metrics That Actually Matter (Broken Down by Funnel Stage)
Not all metrics are created equal—and they shouldn’t be treated the same at every stage of your B2B marketing funnel.
The metrics that matter at the top of the funnel aren’t the same ones that matter when your sales team is chasing signatures.
Here’s how to separate signal from noise, based on where your prospect is in their buyer journey:
Top of Funnel (TOFU): Awareness & Attraction
At this stage, your goal is visibility with the right audience—not just anyone with a browser. You’re planting seeds.
Organic Traffic (by Source & Intent) Track who is coming to your site and why. Segment by source (Google, LinkedIn, referrals) and prioritize high-intent content.
New vs. Returning Visitors Are you attracting new audiences or just speaking to the same people? You need both—but for different reasons.
Branded Search Volume If more people are Googling your company name or product, you’re winning awareness.
Engagement Time on Site Time spent on page matters more than bounce rate. Especially if they're reading deep-dive content or case studies.
Middle of Funnel (MOFU): Engagement & Nurture
This is where curiosity turns into consideration. You need to know who’s leaning in.
Lead Magnet Conversion Rate Are your whitepapers, webinars, or gated assets converting? If not, you may have a traffic-quality or offer mismatch.
Form Fills (by Persona & Source) It’s not just how many leads—who they are matters. Track job titles and industries.
Email CTRs & Replies (not just opens) Especially in nurture campaigns. Are people clicking? Even better—are they replying?
Content Engagement Depth Scroll depth on articles. % watched on videos. PDF downloads. Are they consuming what you worked so hard to create?
Bottom of Funnel (BOFU): Pipeline & Sales Readiness
Now it’s all about revenue. Time to get ruthless with your metrics.
Marketing-Qualified Leads (MQLs) → Sales-Qualified Leads (SQLs) Your MQL-to-SQL rate is a key health check on both your targeting and your alignment with sales.
Cost per Opportunity You don’t just want cheap leads—you want affordable pipeline. This metric will expose bloated channels quickly.
Lead-to-Close Velocity How long does it take for a lead to become a closed-won deal? Speed = signal.
Pipeline Generated (by Channel) Each marketing initiative should have a direct or assisted hand in pipeline. If it doesn’t, it’s fluff.
By aligning your metrics to your funnel stages, you create clarity—not just for marketing, but for sales, leadership, and your P&L. If your dashboard doesn’t tell you where leads are stalling or accelerating, it’s time to rewire it.
If your team is running account-based marketing (ABM)—whether light-touch or fully orchestrated—you can’t rely on lead volume alone. Traditional funnel metrics don’t tell the full story when you’re targeting a narrow list of high-value accounts with personalized content and multi-channel outreach.
ABM success lives and dies on engagement from the right people at the right companies. Here’s what actually matters:
Target Account Coverage
Are you reaching enough of the right people at each account?
Example metric: % of accounts where you’ve engaged 3+ key decision-makers.
You can’t land a six-figure deal by only talking to an intern.
Account Engagement Score
A composite metric that combines touchpoints (email clicks, ad views, website visits, webinar attendance) from all stakeholders within a target account.
Tools like Demandbase, 6sense, or RollWorks can calculate this.
Think of it like a credit score—but for buying intent.
Marketing-Influenced Pipeline per Account
How much of the opportunity pipeline in your CRM can be traced back to marketing influence?
Attribution isn’t perfect, but if your campaigns touch the account before sales gets involved, you deserve credit.
Average Touchpoints to Engagement
How many emails, ads, or pieces of content did it take before an account “woke up”?
This helps set realistic expectations internally and informs future campaign pacing.
Intent Signal Trends
If you’re using intent data, are your named accounts researching relevant topics or competitors?
A spike in intent signals may indicate readiness—even before they fill out a form.
ABM isn’t about more leads. It’s about deeper relationships with fewer accounts.
These metrics help you monitor that depth—and make sure your marketing dollars are generating traction where it counts.
Revenue-Centric Metrics (The Only KPIs the CFO Cares About)
Let’s be real: your C-suite doesn’t care how many likes you got on LinkedIn or how many people opened last Tuesday’s newsletter. They care about pipeline. They care about efficiency. They care about revenue.
If you want marketing to sit at the grown-up table, these are the metrics that matter most:
1. Customer Acquisition Cost (CAC)
The total cost of acquiring a customer (ad spend + software + salaries + agency fees, etc.)
Useful when segmented by channel, campaign, or buyer persona.
If your CAC is growing faster than revenue, you’ve got a problem—fast.
High CAC = unscalable growth. Get it under control.
2. Customer Lifetime Value (LTV)
Total expected revenue from a customer over their lifetime.
Critical for B2B SaaS or subscription-based models.
When paired with CAC, it helps you make smarter decisions about spend.
LTV tells you what a customer is worth. CAC tells you what they cost.
3. CAC:LTV Ratio
The holy grail of efficiency.
Healthy benchmarks:
3:1 is good
5:1 may indicate under-investment
1:1 or lower = you're burning cash
4. Marketing-Sourced Revenue
How much revenue can be directly attributed to marketing efforts?
This includes first-touch, last-touch, and everything in between.
If this number is low, your “awareness campaigns” may not be pulling their weight.
5. Pipeline Contribution (Marketing vs Sales)
What % of total pipeline originated with marketing vs. outbound sales?
Essential for understanding what’s truly driving growth.
Helps align resources across departments and justifies budget.
6. Revenue per Lead / Revenue per Opportunity
What’s the actual dollar value associated with the leads you're sending to sales?
Helps differentiate between high-quality and low-quality lead sources.
If your reports don’t include these numbers—or can’t explain how your SEO, ads, and content map back to them—you’re not doing marketing. You’re doing theater.
Attribution & Multi-Touch Realities
In an ideal world, a lead would click your ad, fill out a form, take a demo, and sign the contract—all while perfectly tracked in your CRM.
In the real world? They read a blog post six months ago, heard your CEO on a podcast, saw a LinkedIn ad, checked out three competitor sites, ignored five emails, Googled your brand name, and then converted.
Good luck attributing that to one “channel.”
The Limits of Single-Touch Attribution
First-touch attribution gives all credit to the first interaction (usually organic search or paid ads).
Last-touch attribution gives all credit to the final click before conversion.
Both are oversimplified—and dangerous in B2B, where buying cycles are long and complex.
Relying on single-touch attribution in B2B is like giving credit for a touchdown to the person who handed the ball off at the 1-yard line.
The Case for Multi-Touch Attribution
Multi-touch attribution (MTA) considers all interactions across the buyer journey.
Common models include:
Linear – Even credit across all touchpoints
Time decay – More credit to recent touchpoints
U-shaped – Emphasizes first touch and lead conversion point
Custom models – Based on your sales process and CRM behavior
Attribution Tools That Work in B2B
HubSpot – Great for small to mid-sized teams
Salesforce + Bizible – Ideal for enterprise teams with complex sales orgs
Dreamdata, HockeyStack, or Triple Whale – Built for modern, B2B attribution with full-funnel visibility
Google Analytics 4 – Good for directional insight, but often underpowered for B2B
What You Should Actually Do
Use attribution as a compass, not a calculator.
Triangulate insights from multiple tools and buyer interviews.
Trust sales conversations and closed-won notes—not just UTM codes.
Marketing attribution in B2B isn’t about perfection. It’s about creating enough visibility to make smarter decisions. When in doubt, ask your closed-won customers: “How did you first hear about us?” Their answers might surprise you—and they won’t be in your CRM.
Metrics by Channel (What You Should Track in Each)
Each marketing channel has its own behavior, benchmarks, and BS. One-size-fits-all metrics are a fast way to waste money—or worse, misinterpret what’s actually working.
Below are the metrics that matter most, channel by channel:
SEO (Search Engine Optimization)
Organic Sessions (by intent) – More isn’t always better. Segment by informational vs. transactional keywords.
Keyword Rankings (for $$ terms) – Focus on commercial-intent queries that generate leads.
Click-Through Rate (CTR) – Shows how compelling your titles/descriptions are in the SERPs.
Conversion Rate (Organic Only) – If your traffic is growing but leads aren’t, revisit your content strategy.
Backlinks (Quality > Quantity) – Especially those from referring domains in your niche.
SEO is a slow burn—track long-term ROI, not just rankings.
PPC (Search & Display Ads)
Cost per Click (CPC) – A useful benchmark, but not the end goal.
Cost per Lead (CPL) – Must be segmented by intent and landing page.
Conversion Rate (Post-Click) – Focus on what happens after they land.
Quality Score (Google Ads) – Impacts CPC and reach. Optimize for relevance.
Open rate inflation (Apple privacy)
Low list hygiene skews results
Webinars & Events
Attendance rate
Engagement during event
Replay views
Pipeline attribution
High signups, low show-up
Poor sales follow-up post-event
Content Syndication
Lead volume
MQL to SQL rate
Conversion rate by partner
Low-quality leads
Weak partner attribution
How to Build a Reporting Dashboard That Doesn’t Suck
Most marketing dashboards are either a bloated mess of meaningless metrics or a barren wasteland with one lonely CTR stat. Neither tells a useful story. If your dashboard doesn’t help you make decisions, it’s not a dashboard—it’s decoration.
Here’s how to build a reporting system that actually helps you win:
1. Focus on Outcomes, Not Activity
Stop reporting on what you did. Start reporting on what it did for the business.
❌ “We published 8 blog posts and ran 4 webinars.” ✅ “Our blog generated 14 MQLs and influenced $72K in pipeline. Webinars sourced 2 SQLs and accelerated 1 deal.”
2. Customize Reports by Stakeholder
Executives want revenue, pipeline, CAC, and ROI. Period.
Sales teams care about lead quality, velocity, and conversion rates.
Marketers need channel performance, engagement metrics, and insights for optimization.
One dashboard does not fit all. Tailor the data to the decision-maker.
3. Build for Simplicity, Not Complexity
Use no more than 5–7 key metrics per report.
Group metrics by funnel stage, channel, or campaign.
Use visual cues like sparklines, bar graphs, or traffic lights—nobody wants to decode pivot tables every morning.
4. Choose Tools That Do the Heavy Lifting
Google Looker Studio (formerly Data Studio) – Great for free, visual dashboards.
HubSpot – Built-in reporting for MQL to SQL tracking and campaign attribution.
Salesforce + Tableau/Bizible – For complex, cross-departmental reporting.
HockeyStack / Dreamdata / Triple Whale – Modern options for B2B attribution and revenue tracking.
Your dashboard should work harder than your marketing intern. If it doesn’t, rebuild it.
5. Automate What You Can, Review What You Must
Set up weekly or monthly automated reports, but don’t just let them run in the background.
Block time each month to interpret trends, question anomalies, and refine campaigns.
Dashboards don’t create value. Your interpretation of them does.
Bonus Tip: Include a “What to Do Next” Section
Every dashboard should have a takeaway:
What’s working?
What needs adjusting?
What do we test next?
It turns data from static to strategic.
Aligning Metrics with Strategy
It’s one thing to measure what’s happening—it’s another to ensure that what’s happening actually supports your business objectives. That’s where most marketers drop the ball.
Marketing metrics without strategic alignment are just noise. Your KPIs should directly map to the things that matter most to your organization: growth, efficiency, pipeline velocity, and profitability.
1. Tie Metrics to Business Goals
Every marketing activity should support a strategic goal:
If a metric doesn't help you achieve one of these, it belongs in a marketing trivia night—not your dashboard.
2. Use Benchmarks to Set Expectations
Saying your CPL is $150 is meaningless unless you know that:
Industry average is $200
Last quarter was $175
High-performing channels bring in leads at $95
Benchmarking brings clarity—and helps you justify budget increases or reallocations.
3. Create a Closed-Loop Feedback Loop
Sync regularly with sales to understand lead quality and pipeline impact.
Use CRM data to trace which campaigns are influencing revenue (not just traffic).
Have monthly strategy sessions where marketing, sales, and leadership align on what success looks like—and if you’re hitting it.
Marketing doesn't exist in a vacuum. Strategy should evolve with data—and data should be shaped by strategy.
4. Prioritize Actionable Metrics
Good metrics don’t just inform—they provoke action.
If CPL is rising: Pause underperforming campaigns or adjust targeting.
If MQL-to-SQL rate drops: Refine your lead scoring or messaging.
If LTV:CAC ratio shrinks: Reassess retention, upsell strategies, or acquisition spend.
Metrics should guide your next move—not just explain the last one.
When strategy and metrics are in sync, your marketing isn’t just reporting performance—it’s driving it.
Common Mistakes to Avoid
Even experienced B2B marketers fall into traps when it comes to tracking (and presenting) marketing metrics. The tools make it easy to measure everything—but that’s exactly the problem.
Here are some of the most common mistakes that quietly kill marketing performance, trust, and budget:
1. Tracking Too Many Metrics
When everything is important, nothing is. Bloated dashboards confuse stakeholders and bury insights. Focus on the few KPIs that actually move revenue, not a buffet of meaningless data.
❌ “We track 67 KPIs.” ✅ “We track 7 that tell us where to invest next month.”
2. Reporting Activity Instead of Outcomes
Your execs don’t care how many blog posts you wrote or emails you sent. They care about what those activities delivered in terms of leads, pipeline, and revenue.
Stop saying: “We ran 3 webinars.” Start saying: “Our webinars generated 14 SQLs and $40K in influenced pipeline.”
3. Ignoring Sales Feedback
If your leads look good on paper but your sales team thinks they’re junk, your metrics are lying to you. Closed-loop reporting with sales is non-negotiable.
Your best metric? Sales actually wants to call your leads.
4. Failing to Segment
Averages lie. Segment by channel, buyer persona, industry, funnel stage—whatever gives you clarity. One superstar campaign can mask five that are quietly wasting budget.
5. Relying on Vanity Metrics to Prove ROI
Just because something is easy to measure doesn’t mean it matters. Impressions, likes, and open rates don’t pay the bills unless they correlate to pipeline or revenue.
Marketing theater is not marketing strategy.
6. Not Benchmarking Over Time
A $200 CPL might be fine—unless last quarter it was $120. Without historical benchmarks, you can’t spot trends, diagnose problems, or make confident strategic moves.
7. Letting Tools Dictate What You Track
Tools are built to be flexible, but many teams default to whatever their CRM or ad platform surfaces by default. That’s lazy.
Define your strategy first, then bend the tools to fit it—not the other way around.
Mistakes in metric strategy aren’t just embarrassing—they’re expensive. They mislead teams, misalign departments, and can cost your marketing team credibility when it matters most.
Metrics as a Compass, Not a Crutch
B2B marketing isn’t about looking busy—it’s about driving pipeline, shortening sales cycles, and fueling revenue growth.
The right metrics tell you what’s working, what’s not, and where to go next.
The wrong ones?
They just make your dashboard look pretty.
So here’s the bottom line: measure what matters.
Ignore the noise.
Ditch the vanity.
Build a measurement framework that’s grounded in real business outcomes, not just digital activity.
Align it to strategy, clean up the clutter, and get buy-in from sales and leadership.
Your metrics should be a compass—guiding your decisions, validating your experiments, and charting a path toward scalable growth.
But they should never be a crutch that excuses bad performance or hides behind high click-through rates.
Because at the end of the day, likes don’t pay invoices.
Pipeline does.
Author
Timothy Carter
Chief Revenue Officer
Timothy Carter is a digital marketing industry veteran and the Chief Revenue Officer at Marketer. With an illustrious career spanning over two decades in the dynamic realms of SEO and digital marketing, Tim is a driving force behind Marketer's revenue strategies. With a flair for the written word, Tim has graced the pages of renowned publications such as Forbes, Entrepreneur, Marketing Land, Search Engine Journal, and ReadWrite, among others. His insightful contributions to the digital marketing landscape have earned him a reputation as a trusted authority in the field. Beyond his professional pursuits, Tim finds solace in the simple pleasures of life, whether it's mastering the art of disc golf, pounding the pavement on his morning run, or basking in the sun-kissed shores of Hawaii with his beloved wife and family.


.svg)


