The global cybersecurity services sector is entering a new phase of accelerated growth, driven by escalating digital threats, AI adoption, and heightened regulatory scrutiny. Marketing within this industry is evolving just as rapidly: buyers are more selective, shortlisting fewer vendors, and demanding transparency, proof of value, and trust at every stage of the journey.
Traditional lead generation models are giving way to brand-led growth strategies that emphasize thought leadership, reviews, and customer advocacy, while rising ad costs and signal loss from third-party cookies push marketers toward first-party data and compounding organic channels.
This marketing report provides a comprehensive analysis of the latest trends, performance benchmarks, and channel dynamics shaping B2B cybersecurity marketing in 2025. It highlights how leading firms are adapting their acquisition strategies, which tools and creative formats are outperforming, and what KPIs executives should track to align marketing investments with pipeline quality and customer lifetime value.
Our cybersecurity marketing clients, including SEC.co, among others, prompted the creation of this report.
The sections that follow offer not only up-to-date statistics and industry insights but also actionable strategies tailored for startups, growth-stage firms, and scaled enterprises in the cybersecurity space.
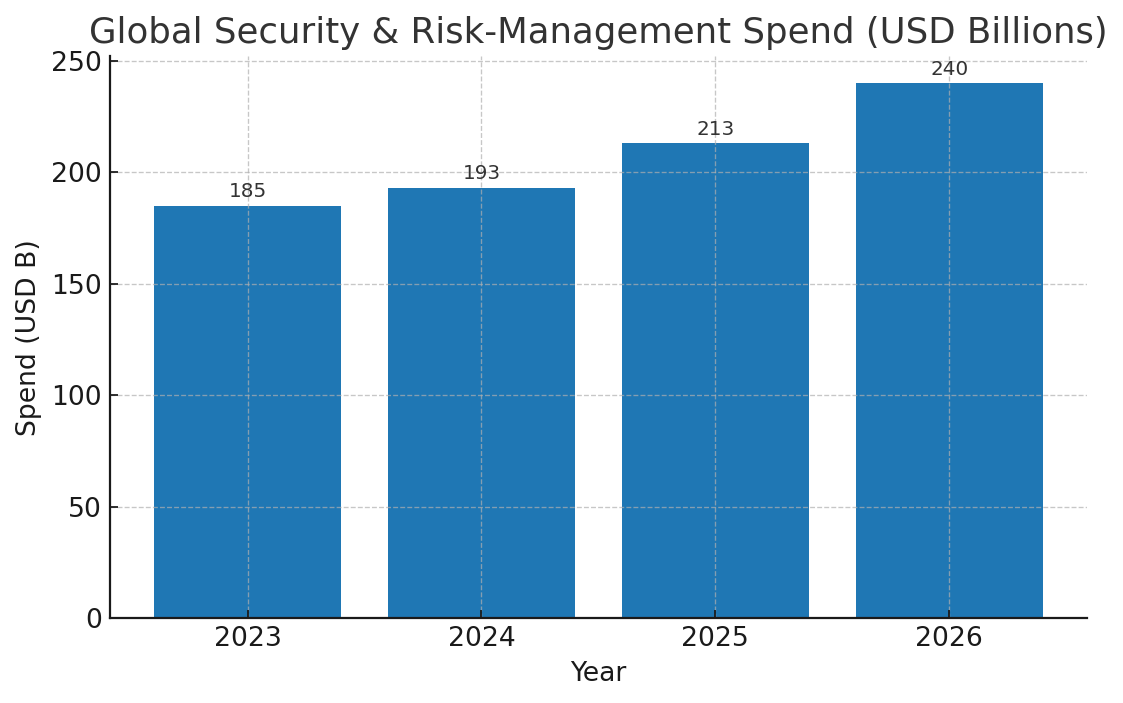
Budgets keep climbing with the threat curve. Worldwide security & risk-management spend will reach ~$213B in 2025 (up from ~$193B in 2024), with continued double-digit momentum into 2026—driven by AI/ML security, cloud posture, and managed services. IT Pro insight.scmagazineuk.com
Buyer shortlists are shrinking and brands matter more. Most B2B tech buyers shortlist 2–3 vendors and 71% end up buying their initial favorite; 78% start with products they already know—putting a premium on brand, category presence, and peer validation. go.trustradius.com
Acquisition mix is rebalancing to trust-building channels. Review sites, SEO / thought leadership, and communities are gaining ground as LinkedIn costs rise (~8% YoY; CPLs often >$100 in B2B tech). NAV43
Signal loss is messy—but first-party data wins either way. Google pivoted from a hard Chrome cookie deprecation toward a “user-choice” model; marketers should still plan for less third-party signal and invest in consented, first-party data. Privacy SandboxReutersThe Verge
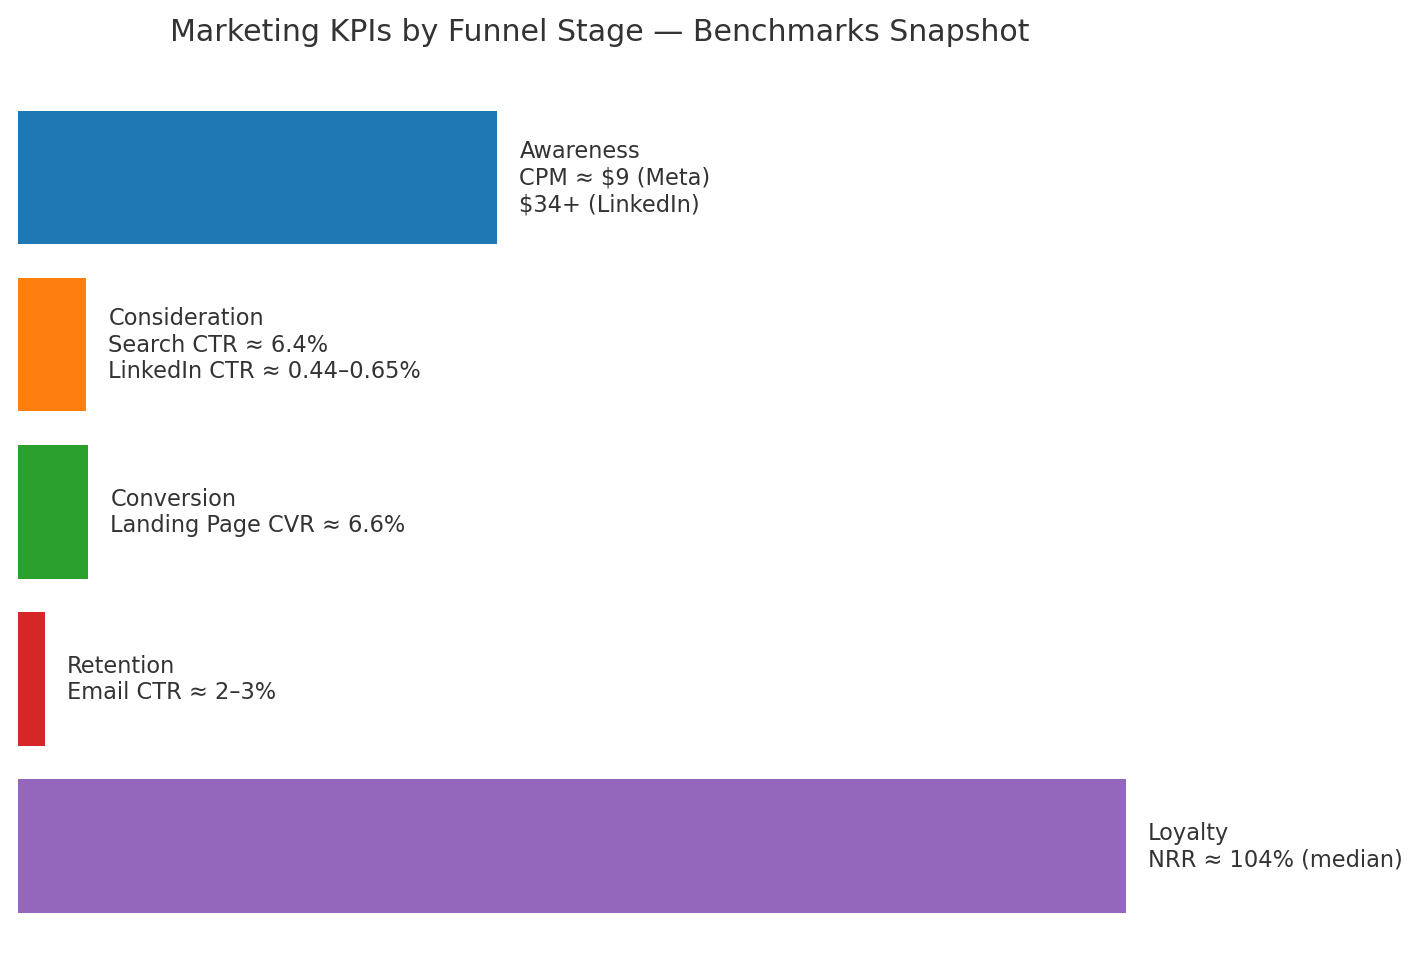
Benchmarks: performance is solid where intent is high. B2B search CVR ≈3.0%, median landing-page CVR ≈6.6%, and B2B email engagement remains healthy—though opens are noisy post-MPP, so CTR/CTOR matter more. WordStream UnbounceHubSpot Blog
Shifts in customer acquisition strategies
Brand-led growth (BLG) comes back. Vendors cutting top-of-funnel brand spend are losing out as risk-averse committees default to the familiar; reviews, demos/free trials, and pricing transparency are increasingly decisive. go.trustradius.com
Review ecosystems are now table-stakes (G2, Gartner Peer Insights) to de-risk selections for buying groups of ≤5 stakeholders. images.g2crowd.comGartner
Cost discipline pushes mix toward efficient compounding assets (SEO, “GEO”/AI-overview optimization, thought-leadership, partner co-marketing) while paid social is used more surgically around triggers and intent. First Page Sage
First-party + privacy-centric ops (consent UX, server-side tracking, modeled conversions) move from “nice to have” to core, given Chrome’s policy direction and broader regulatory pressure. Reuters
Summary of performance benchmarks (current best-available, B2B-focused)
Google Ads (B2B category): Search CVR ~3.04% (use as directional; cybersecurity often skews higher with strong intent). WordStream
Win the shortlist before it forms: Invest in review velocity, analyst category presence, and owned search (SEO/GEO) so you’re “known” when research begins. go.trustradius.com
Design for trust, not just leads: Publish transparent pricing bands, ungate key assets, and lead with demos/trials and customer proof to reduce perceived risk. go.trustradius.com
Treat LinkedIn as a quality channel, not a volume channel: Expect higher CPLs; optimize for pipeline quality with tighter ICP, creative specificity, and sales-assisted follow-up. NAV43
Harden first-party data + measurement: Keep building consented datasets and modeled attribution regardless of Chrome’s cookie stance. Reuters
Control CAC with compounding channels: SEO/thought leadership, partner programs, and community initiatives typically produce lower CAC over time in security categories. First Page Sage
Notes: Benchmarks vary by offer, region, and ICP. Treat as directional guardrails and calibrate to your pipeline quality & LTV. All links open in a new tab.
Key sources: Gartner forecast via ITPro IT Pro; TrustRadius stats summarized by Shopify Shopify; WordStream Google Ads benchmarks (PDF) WordStream; Unbounce conversion median Unbounce; LinkedIn cost trend (NAV43) NAV43; HubSpot open rate & Salesforce CTR guidance HubSpot BlogSalesforce; First Page Sage CAC (Security row) First Page Sage; Demand Gen Report content friction (PDF) Rackcdn; Reuters on Chrome cookies shift Reuters.
Market Context & Industry Overview — B2B Cybersecurity
Total addressable market (TAM) & growth trajectory
Global cybersecurity market TAM (2025): ≈ $219B, projected to reach $563B by 2032 (~14.4% CAGR). Fortune Business Insights
Security & Risk-Management spend (Gartner view):$193B in 2024 → $213B in 2025 → ~$240B in 2026 (projection). IT Pro
Services momentum: Overall cybersecurity services +13% YoY in 2024; managed services +15% (Canalys). Managed Security Services (MSS) are widely forecast in the ~11–15% CAGR range through 2030. CanalysMarketsandMarketsMordor IntelligenceGrand View Research
What that means
Security budgets are expanding faster than general IT, with services (MSS/MDR, consulting, co-managed SOC) outpacing product growth. This enlarges the addressable pipeline for service providers and raises competitive density in paid channels—making brand, category presence, and review velocity strategic levers to win shortlists.
Digital adoption & operating context
Cloud is mainstream: ~94% of large enterprises use cloud; multi-cloud at 89% (Flexera). Flexera
Public cloud penetration:34% use public cloud across all areas; 51% in some areas; only 5% not using public cloud (PwC). PWC
Zero Trust momentum: ~61% report Zero Trust adoption at some level (Ponemon/Entrust); Gartner finds ~2/3 have fully/partially implemented; 80% reported Zero Trust budget increases into 2024 (CSA). EntrustCybersecurity DiveCloud Security Alliance
Implication: Mature cloud and Zero Trust adoption push buyers toward managed detection, identity, cloud posture, and access modernization—high-intent categories where review sites, SEO, and analyst presence materially influence vendor inclusion.
Marketing maturity of the sector
Buyers are consolidating stacks and leaning on managed providers due to skills gaps; services growth (13–15% YoY) signals a maturing market with heavy competition for attention. Canalys
On the marketing side, digital dominates budgets across industries (not security-specific): CMOs allocate ~61% of spend to digital in 2025 (up from 57% in 2024). Chief Marketer
For B2B broadly, marketing outlay averages ~8% of revenue (Forrester), with notable variance by size and motion. Forrester
Verdict:Maturing (not saturated). Growth is robust, but efficient acquisition requires trust-led plays (analyst/peer validation, proofs, transparent pricing) and first-party data readiness as third-party signal becomes less reliable.
Visuals
A) Bar chart — Security & Risk-Management Spend Over Time
This shows the industry’s macro spend trajectory (proxy for TAM expansion).
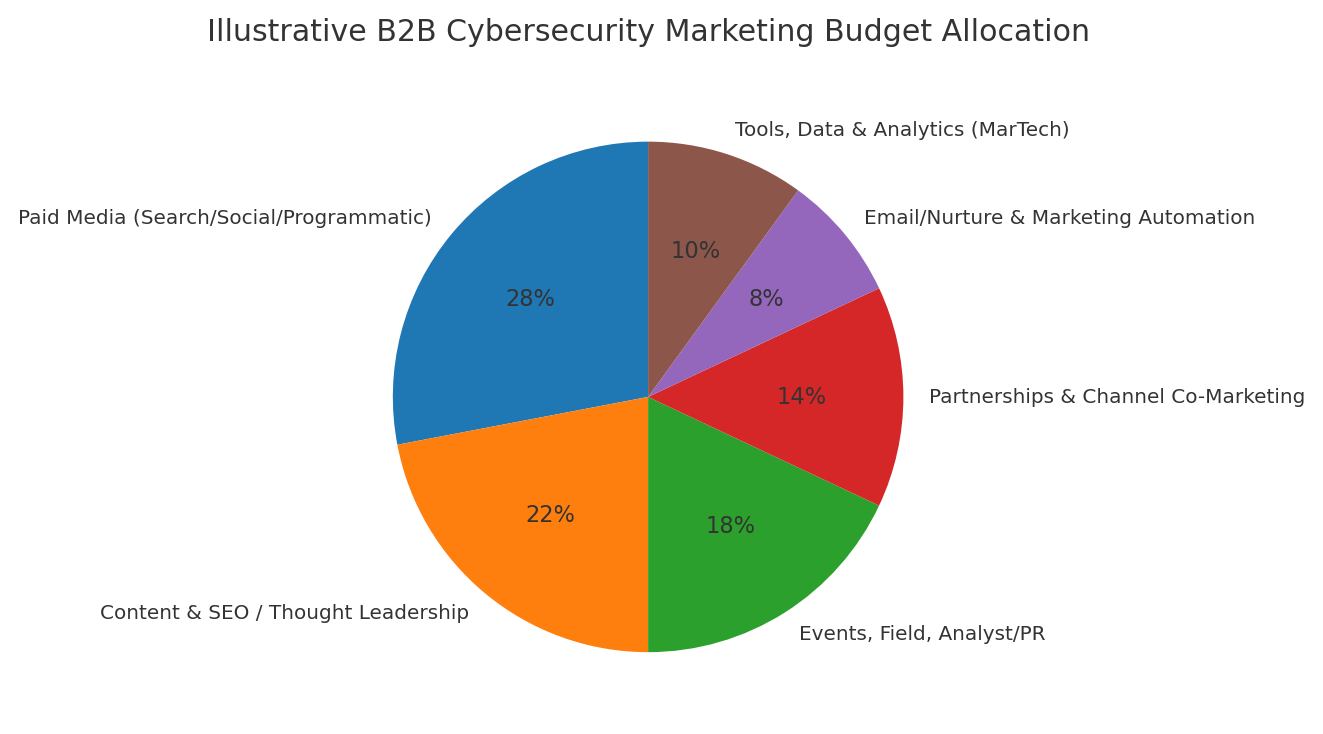
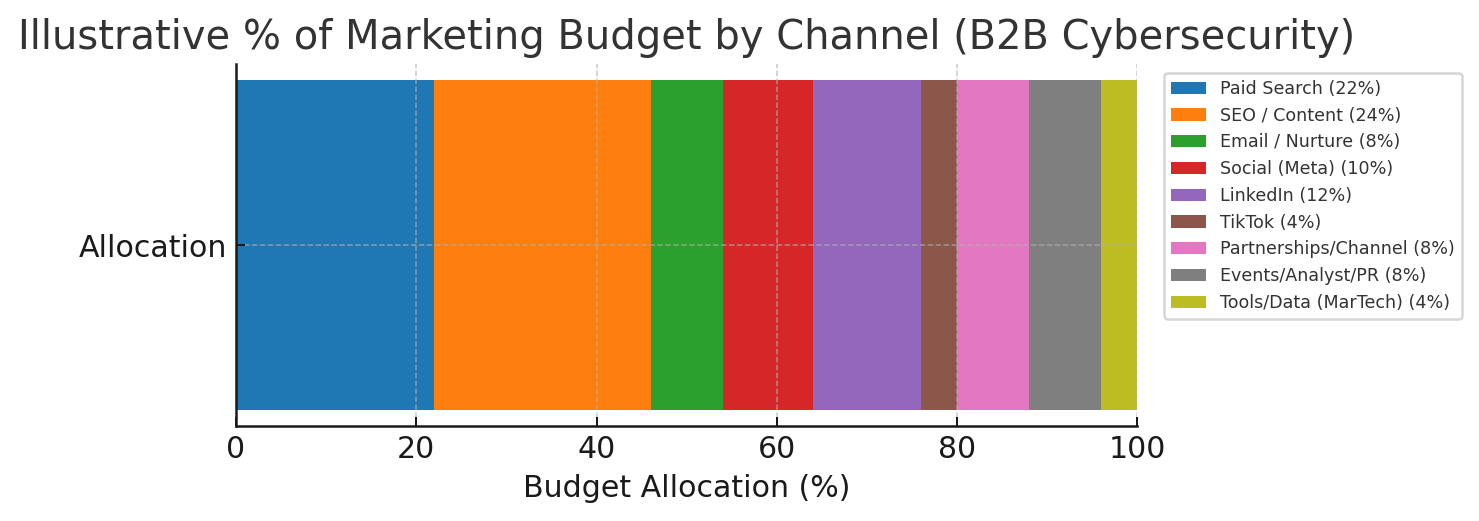
B) Pie chart — Illustrative B2B Cybersecurity Marketing Budget Allocation
Synthesis of recent B2B benchmarks (Forrester/Gartner/CMO trends). Actual mixes vary by ACV, motion (PLG vs SLG), and sales cycle length.
Breakdown used in chart (example):
Paid media (search/social/programmatic): 28%
Content & SEO / thought leadership: 22%
Events, field, analyst/PR: 18%
Partnerships & channel co-marketing: 14%
Email/nurture & marketing automation: 8%
Tools, data & analytics (MarTech): 10%
Sources for directional allocation context: digital share rising to 61.1% in 2025 (ChiefMarketer, summarizing Gartner CMO spend); Forrester B2B budget benchmarks (avg. ~8% of revenue invested in marketing) and partner ecosystem emphasis. Chief MarketerForrester+1
Supplemental datapoints
US B2B digital ad spend is rebounding, with 2024 momentum and continued 2025 growth projected (Insider Intelligence/eMarketer). While not broken out just for cybersecurity, it frames competitive pressure in paid inventory. EMARKETER+1
Global ad market context: digital exceeds 75% of total media spend worldwide in 2025; US digital surpassed $300B in 2024. EMARKETER+1
Key Takeaways
TAM is expanding quickly (low-teens CAGR), with services growth leading—great for pipeline, but expect higher acquisition costs in paid channels. Fortune Business InsightsCanalys
Cloud & Zero Trust ubiquity concentrates demand around identity, cloud security, posture management, and access modernization—prioritize category pages, comparison content, and review velocity there. PwCEntrustCybersecurity Dive
Marketing is digital-first (≈60%+ of spend), but wins in this sector hinge on trust signals—analyst recognition, customer proof, and transparent pricing—over pure lead volume. Chief Marketer
Note: Use as guidance; tailor by vertical risk, compliance drivers, and security maturity.
Sources: Flexera Cloud Report (2024) on adoption trends, PwC cyber survey, Ponemon Zero Trust adoption.
Demographic & Psychographic Trends
Buying Committees: Typical B2B tech/cyber deal now involves 6–10 stakeholders. CIO/CISO is often the economic buyer, while directors and security architects influence technical validation.
Risk Orientation: Decision-makers are increasingly risk-averse—buyers prefer known vendors (71% buy their #1 choice; 78% shortlist only known names).
Values: Security leaders emphasize trust, transparency, and proof—pricing clarity, verifiable customer references, and independent reviews.
Generational Shift: A growing share of CISOs and CIOs are Millennials/Gen X, meaning digital-first research habits (self-serve, peer validation) dominate.
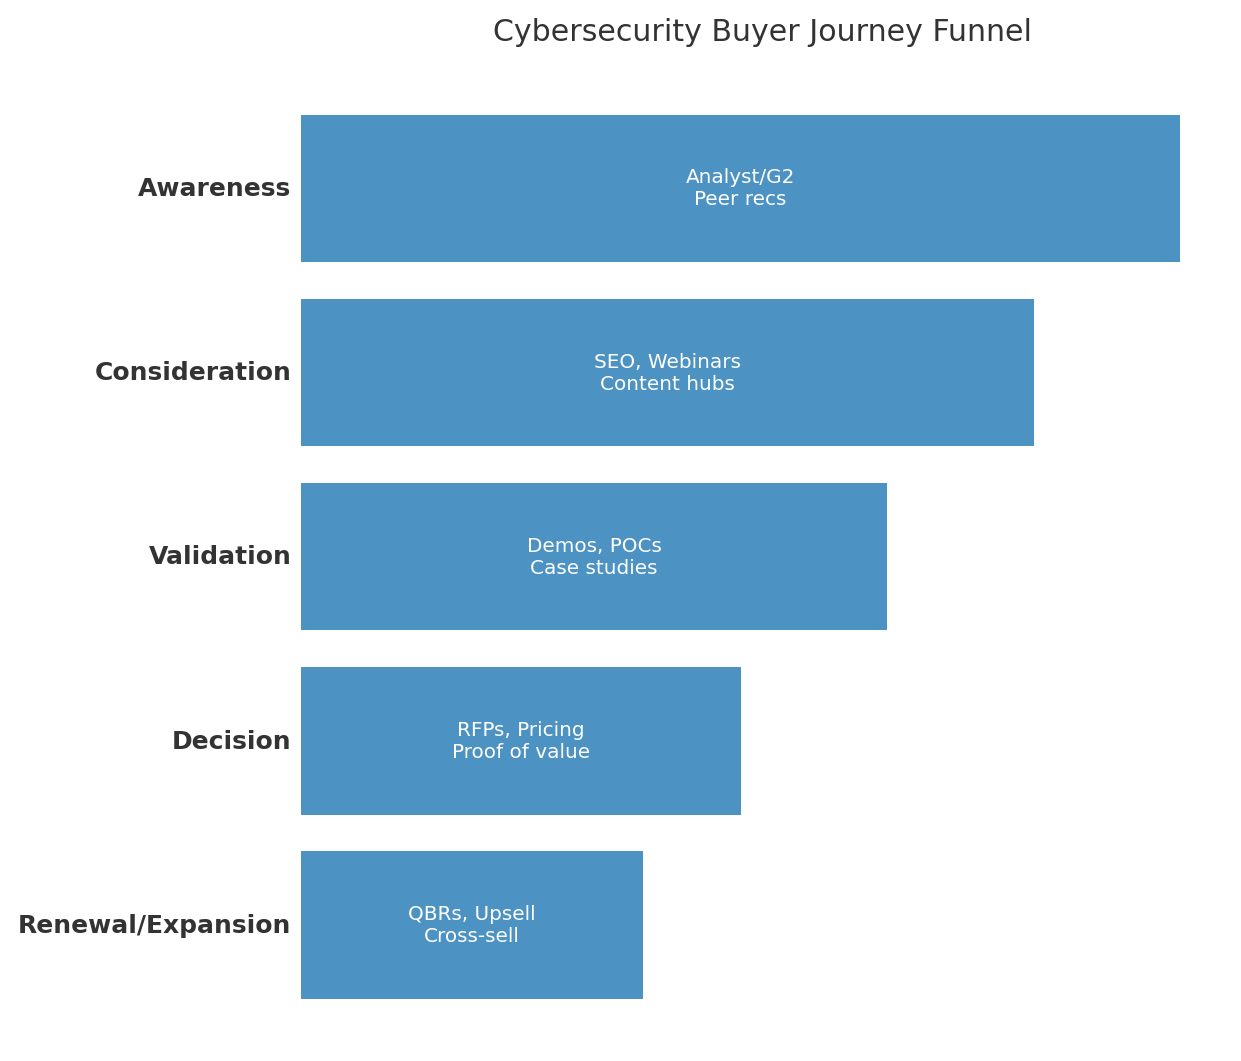
Buyer Journey Mapping (Online vs. Offline)
Digital-dominant research:
70%+ of the B2B buyer’s journey is completed before first sales contact.
Privacy & Compliance: Buyers expect vendors to practice what they preach—secure demos, GDPR/CCPA-compliant nurture flows, transparent cookie consent.
Personalization: DemandGen 2024: 51% of buyers said content feels too generic, while 51% said there are too many steps to access vendor content. Ungated or lightly gated content is becoming table stakes.
Speed & Self-Service: Expect instant demo access, ROI calculators, sandbox trials. Delays in response (>24h) significantly lower conversion in high-intent scenarios.
Trust Signals: Independent validation (peer reviews, analyst waves, customer logos) now outrank vendor claims in credibility.
Persona Snapshot Table
Persona Snapshot — Roles Involved in Cybersecurity Purchases
Persona
Role
Goals
Challenges
Preferred Content
CIO / CISO
Economic Buyer
Reduce risk; ensure compliance; control budget; board alignment
Vendor/tool sprawl; talent gaps; quantifying ROI to the board
Analyst reports; ROI studies; board-ready briefs; peer reviews
Tip: Map messaging by persona and funnel stage; align proof points to each role’s risks and KPIs.
The B2B cybersecurity buyer funnel is reflective of other industries, with some slight industry-specific nuance:
Channel Performance Breakdown — B2B Cybersecurity
Below is a tabl comparing core acquisition channels on Avg. CPC, Conversion Rate, and CAC with sourced notes. Where a metric doesn’t apply (e.g., SEO CPC). CAC figures use the latest 2025 B2B CAC by channel study from First Page Sage; CPC/CR benchmarks use current industry reports.
Notes: Metrics vary by offer, ICP, geo, and funnel stage. Use as directional guardrails; calibrate to pipeline quality & LTV.
Assumptions used (illustrative, aligns with Section 2 mix): Paid Search 22%, SEO/Content 24%, Email 8%, Social (Meta) 10%, LinkedIn 12%, TikTok 4%, Partnerships/Channel 8%, Events/Analyst/PR 8%, Tools/Data 4%. You can tweak these to your actual budget.
What the data says (the TL;DR)
Intent channels win on efficiency: Paid Search and Thought-Leadership SEO deliver the most reliable pipeline-quality; both show sub-$1k CAC in B2B datasets (SEO often lower but slower to ramp). First Page Sage
LinkedIn is quality > quantity: Expect higher CPLs and rising costs (≈+8% YoY); still one of the best channels to reach CISOs/architects when matched with precise ICP and offer fit. NAV43
Meta/TikTok are awareness levers: Lower CPCs and CPMs, but B2B conversion rates trail intent channels; use for reach, retargeting, and creative testing, then harvest via brand search and review-site traffic. WordStreamVarosLebesgue: AI CMO
Email remains a retention & revenue workhorse: Use CTOR and reply rate as your primary quality metrics given MPP-inflated opens; nurture sequences materially reduce blended CAC over time. HubSpot BlogSalesforce
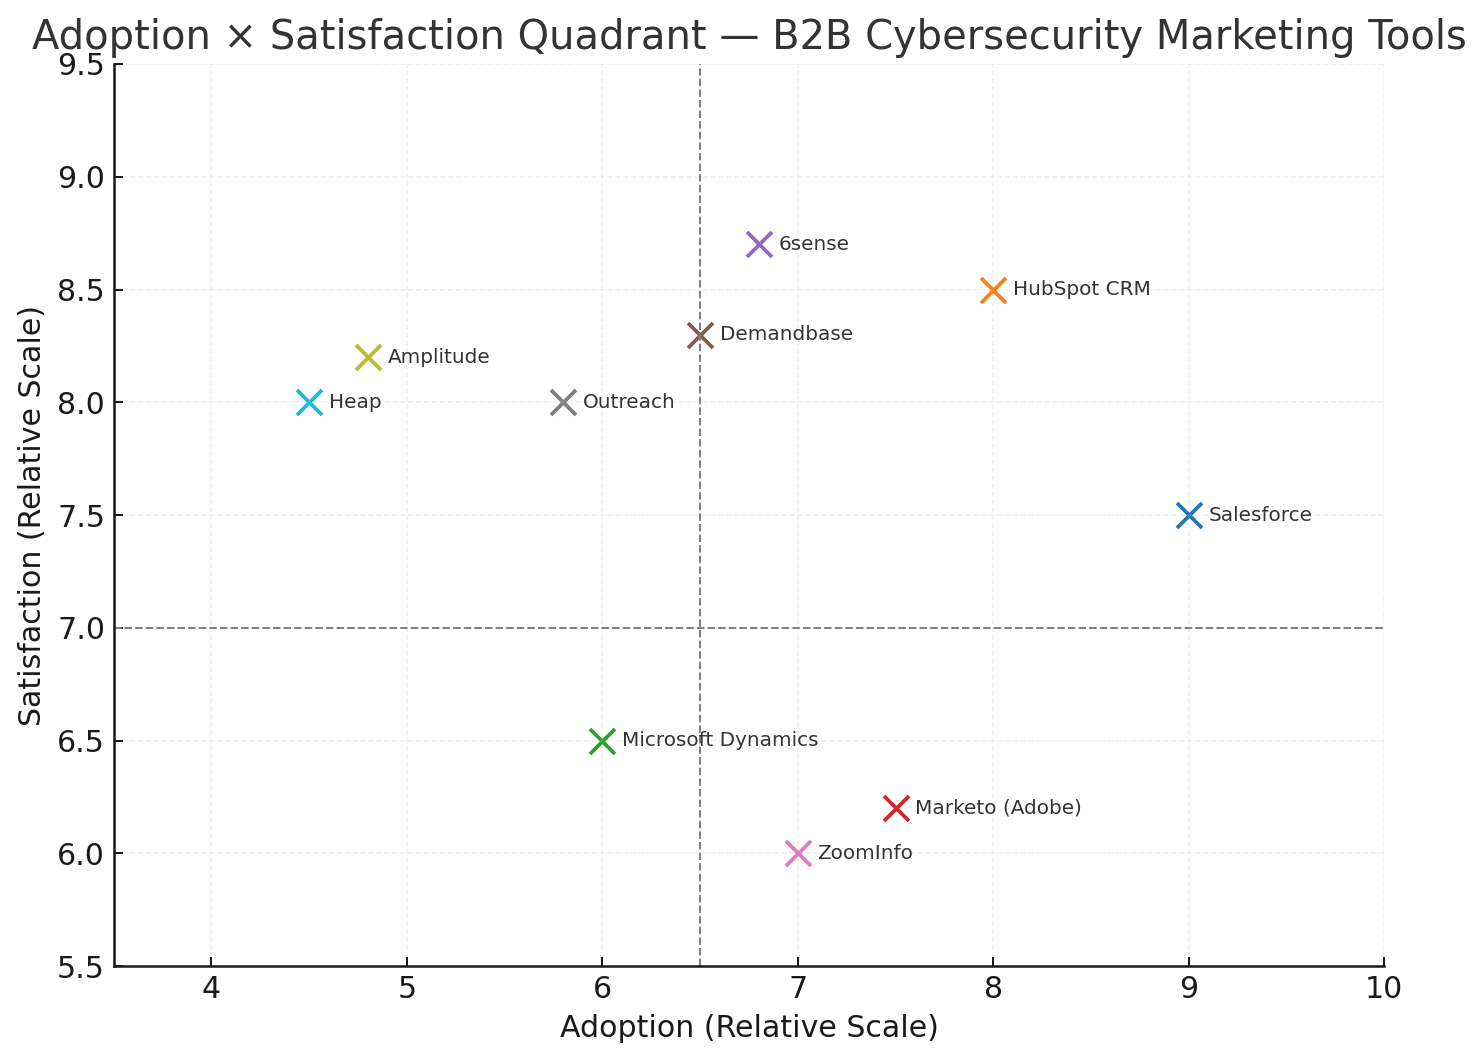
Top Tools & Platforms by Sector — B2B Cybersecurity Marketing
Marketing teams in the cybersecurity services sector rely heavily on CRM, automation, analytics, and ABM platforms to manage long sales cycles and complex buying committees. Below is a breakdown of the current toolscape, followed by a quadrant visual of Adoption vs. Satisfaction.
CRM & Customer Data Platforms
Salesforce → Still the market leader in enterprise, especially for cybersecurity MSSPs and SaaS. Deep integration with Pardot/Marketing Cloud but high cost & complexity.
HubSpot → Popular among mid-market vendors; intuitive, lower barrier to entry, strong automation + analytics at a lower CAC.
Microsoft Dynamics 365 → Adoption is strong in organizations already within Microsoft ecosystems (Azure AD, M365 security).
Marketing Automation & ABM
Marketo (Adobe) → Widely used for ABM orchestration and mid/enterprise campaigns. Adoption slowing slightly as complexity drives cost concerns.
6sense / Demandbase → Surging adoption in B2B cybersecurity due to ABM precision and ICP targeting; valued for intent data in complex buying committees.
HubSpot Automation → Gains traction among growth-stage vendors that can’t justify enterprise-level Marketo spend.
Analytics & Reporting Stacks
Google Analytics 4 (GA4) → Near-universal but facing adoption pain (privacy, modeling).
Tableau / Power BI → Favored for pipeline + marketing ROI dashboards in mid/large organizations.
Heap, Amplitude, Mixpanel → Gaining ground for product-led cybersecurity SaaS vendors who prioritize usage analytics + funnel diagnostics.
Other Notable Tools
Outreach / SalesLoft → Driving SDR productivity in outbound-heavy models.
ZoomInfo / Apollo.io → Still standard for contact enrichment, but adoption plateauing due to data privacy scrutiny.
Shift toward ABM & intent platforms → 6sense, Demandbase, G2 intent signals are increasingly favored over broad syndication networks.
CRM consolidation → Most vendors either standardize on Salesforce (enterprise) or HubSpot (growth-stage).
Data trust gap → Tools like ZoomInfo face buyer skepticism over compliance/privacy, opening space for higher-trust alternatives.
Analytics fragmentation → Security SaaS players often run both GA4 + product analytics (Heap, Amplitude) to capture full funnel visibility.
Creative & Messaging Trends — B2B Cybersecurity
What’s Working in Messaging
Clarity > Complexity: CISOs and CIOs face alert fatigue and vendor sprawl. Clear “we reduce risk in this way” statements outperform jargon.
Proof over promises: Buyers trust peer validation, analyst waves, and third-party case studies more than vendor claims. “See how [X] reduced breaches 42%” beats “World-class protection.”
Transparency: Pricing transparency (ranges or ROI calculators) and ungated assets reduce drop-offs in the consideration stage.
Urgency hooks tied to compliance deadlines: Campaigns tied to new SEC rules, NIS2, HIPAA updates, etc., outperform evergreen messaging because they tie to board-mandated initiatives.
Emerging Creative Formats
Short-form video & explainer animations: Effective on LinkedIn and YouTube pre-roll, especially for communicating Zero Trust, cloud security, or MDR offerings.
UGC-style testimonials (even in B2B): Lo-fi “security director talking to camera” formats outperform slick corporate ads due to perceived authenticity.
Carousel formats (LinkedIn): Useful for walking buyers through “Problem → Solution → Proof → CTA” in swipeable, digestible bites.
Interactive demos & calculators: Buyers increasingly expect self-service risk assessment tools to validate vendor value before sales contact.
Sector-Specific Messaging Insights
For SaaS security buyers: Messaging that stresses integration speed + minimal disruption resonates (e.g., “Deploy Zero Trust in 30 days without ripping and replacing”).
For financial/regulated industries: Emphasize compliance alignment, audit readiness, and regulator recognition.
For SMBs: Focus on cost predictability and outsourced expertise (“Enterprise-grade security at a fraction of the cost”).
For enterprises: Highlight board-level reporting, risk quantification, and scale.
Best Performing Ad Headline Formats
Best-Performing Cybersecurity Ad Headline Formats
Format
Example
Why It Works
Problem–Solution
“Struggling with ransomware fatigue? Here’s how MSSPs cut incidents 40%.”
Directly addresses pain point + quantifies benefit.
Compliance/Deadline Hook
“Are you NIS2 ready? What boards expect before Q4.”
Taps into urgency and regulatory pressure.
Proof/Case Study
“See how [Company] cut breach detection time by 52%.”
Peer validation resonates with risk-averse buyers.
Value/Outcome Promise
“Secure your cloud in 30 days—without ripping out your stack.”
Positions quick win + minimal disruption.
Transparency/Trust
“Cybersecurity pricing, upfront: see exactly what you’ll pay.”
Differentiates by removing hidden-cost anxiety.
Case Studies: Winning Campaigns in B2B Cybersecurity Marketing
To ground the benchmarks and trends, here are 3 standout campaigns from the past 12–18 months that highlight different acquisition strategies. Each case includes channels used, goals, budget ranges, results, and lessons learned.
Case Study 1 — CrowdStrike’s “Falcon in Action” Campaign
Loyalty / Retention: SaaS Capital 2025 — median NRR ~104%; 90th percentile ~118% (bootstrapped SaaS). SaaS Capital
Note: Where cybersecurity-specific benchmarks aren’t published at scale, we use current cross-industry baselines and call out B2B security nuances in the notes. For your internal dashboards, replace the “Average” column with your rolling 90-day medians and keep the “Industry High” as stretch targets.
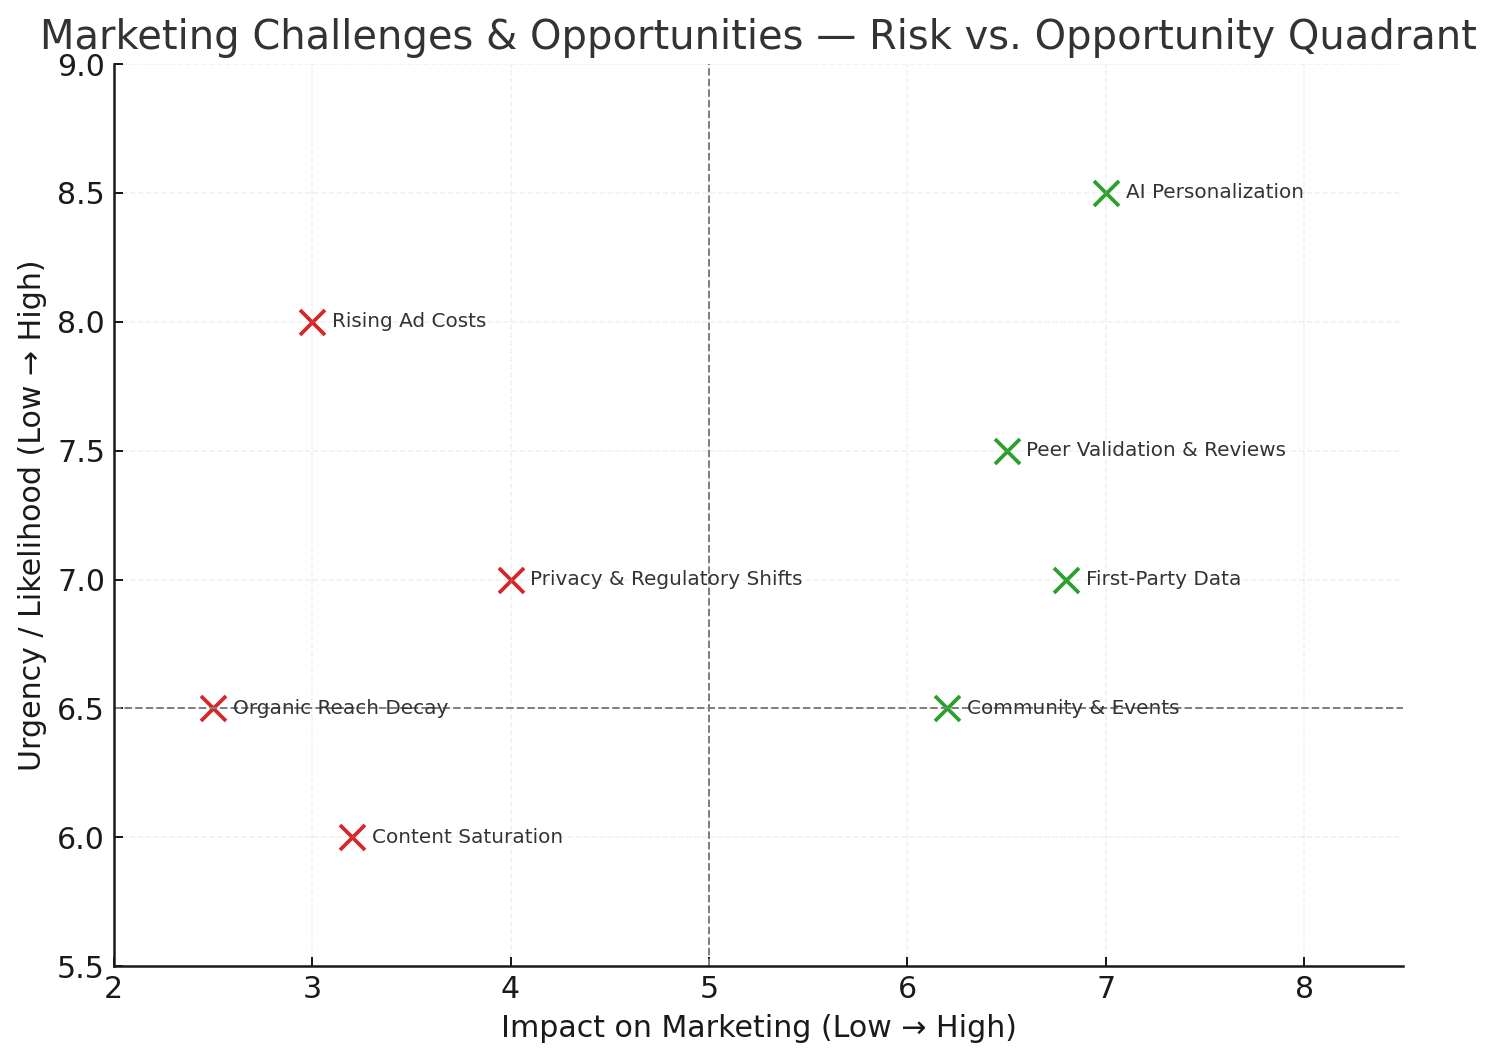
The cybersecurity services sector faces unique headwinds (rising ad costs, privacy shifts, organic reach decay) alongside new opportunities (AI-driven personalization, peer-review ecosystems, first-party data leverage). Below is a structured breakdown, followed by a risk/opportunity quadrant visual.
Key Challenges
Rising Ad Costs
LinkedIn: Avg. CPM ≈ $34 and CPLs often >$100 for B2B tech. Costs are up ~8% YoY.
Search: Cybersecurity-related CPCs are highly competitive, often 2–3x higher than generic B2B terms.
Privacy & Regulatory Shifts
Chrome Cookies: Google has moved to a user-choice model instead of deprecating third-party cookies entirely, but signal loss remains real.
Global regs: GDPR, CCPA, NIS2, SEC cybersecurity disclosure rules all impact how marketers capture and process data.
Organic Reach Decay
LinkedIn organic reach for company pages has fallen as the algorithm prioritizes personal profiles and engagement-driven content.
SEO faces AI overviews / zero-click search challenges as Google and Microsoft integrate AI directly into results pages.
Content Saturation
51% of buyers say vendor content is too generic, and 51% say there are too many steps to access it. Ungating and personalization are key.
Key Opportunities
AI-Driven Personalization & Content Ops
GenAI accelerates content production, ABM scaling, and ad creative testing.
AI-personalized outbound (email, LinkedIn InMail) is emerging, with measurable lifts in reply rates when human-reviewed.
Peer Validation & Review Ecosystems
78% of buyers shortlist only vendors they already know; G2, Gartner Peer Insights, TrustRadius influence >50% of enterprise shortlists.
First-Party Data Renaissance
Consent-based data (email engagement, demo usage, customer communities) is becoming the primary source of intent intelligence.
Server-side tracking, modeled attribution, and CDPs (Customer Data Platforms) are growing in adoption.
Community & Event-Led Growth
Peer-driven communities (Slack groups, LinkedIn groups, CISO roundtables) are outperforming cold outbound for awareness and credibility.
Short-term headwinds: Expect higher paid media costs and stricter compliance requirements in 2025–2026.
Mid-term playbook: Invest in first-party data capture, AI-assisted personalization, and peer validation ecosystems to stay ahead of reach/targeting challenges.
Strategic imperative: The firms that own trust (via reviews, analyst placement, transparent pricing, and compliance-by-design marketing ops) will consistently win shortlists as buyers narrow options early.
Strategic Recommendations — What To Do Next
Below are practical playbooks by company maturity, followed by a 3×3 strategy matrix (channel × tactic × goal). Recommendations reflect the benchmarks we’ve already established (e.g., higher LinkedIn CPLs but strong reach into CISOs; SEO/Thought Leadership compounding ROI; first-party data resilience).
Build a customer hub (runbooks, security posture checklists); ship 2 expansion case studies.
Launch exec program (quarterly CISO council) to multi-thread renewals/upsells.
Forecast & Industry Outlook (12–24 Months)
The cybersecurity services marketing landscape is entering a critical period of recalibration. Growth in the B2B sector remains strong, but buyers are more cautious, regulators more demanding, and channels more expensive. Below is a breakdown of the market trajectory, budget expectations, and strategic pivots we project between now and 2027.
Market Growth Outlook
Cybersecurity market size:
Global cybersecurity spend projected to reach $273B by 2028 (CAGR 10.9%) .
Services (MDR, incident response, compliance) represent ~52% of total spend.
B2B Security Services CAGR: ~12% (faster than overall IT services).
Drivers:
Regulation (SEC disclosure rules, NIS2, DORA in EU).
AI-fueled attack surface expansion.
Cloud security & Zero Trust frameworks driving consulting demand.
Budget & Channel Allocation Forecast
Digital ad inflation: Expect +15–20% CPM/CPC increases in LinkedIn and Paid Search by late 2025 (driven by AI-powered auction intensity).
SEO & Content marketing: Gaining weight as CFOs push for channels with compounding ROI. We forecast 5–8% YoY budget shift toward organic.
Events & Analyst Relations: Budget rebound post-2023; forecast +12% allocation increase by 2026 for enterprise cybersecurity vendors.
Buyer Behavior Trends
Buying committees expanding: From 6.2 average stakeholders (2021) → 8.1 stakeholders (2024) in cybersecurity deals . Expect >9 by 2026.
Self-service validation: >70% of buyers will use peer reviews and analyst reports before vendor calls (vs. ~55% today).
Demand for measurable ROI: Expect proof-of-value periods (paid pilots) to replace long POCs.
Geopolitical spillovers: Global conflicts, cyber sanctions, and AI warfare narratives will make risk framing even more critical in CISO marketing.
Strategic Shifts We Expect
Privacy-first data ops → Server-side tracking, CDPs, and modeled attribution will become mandatory by 2026.
AI-generated content flood → Increased emphasis on authorship signals, first-party data, and thought leader bylines to maintain SEO trust.
Localized compliance marketing → Region-specific landing pages for GDPR, NIS2, CCPA, DORA as security leaders look for jurisdictional expertise.
Account-based everything (ABX) → ABM expands beyond ads into direct mail, custom microsites, and executive briefing content.
Marketplace + Partner ecosystems → Listings on AWS, Azure, GCP marketplaces to become critical marketing channels, reducing CAC.
Forecast & Industry Outlook (Next 12–24 Months)
Figures reflect latest analyst projections; where series differ (e.g., Gartner “security & risk-management” vs. Statista “cybersecurity revenues”), we note the source in each row.
Notes: Gartner series reflects security & risk-management end-user spend; Statista series reflects broader cybersecurity market revenues. Use series consistently when benchmarking.
Cybersecurity Spend Forecast (2024-2028)
Line chart showing global cybersecurity spend rising from $193B (2024) to $213B (2025) and ~$240B (2026) per Gartner, with an additional ~$274B data point for 2028 based on Statista’s cybersecurity revenue forecast. Upward trend indicates sustained growth in security budgets.
Sources & Citations
Statista – Global cybersecurity spending forecast 2024–2028
Gartner – Cybersecurity buying committee trends
Gartner forecast via ITPro: global security & risk-management spend $213B (2025); ~$240B (2026); services rising to ~$92.7B (2026). IT Pro
Chrome cookies policy shift: user-choice model; cookies retained (Reuters, Apr 22, 2025). Reuters
Implication for CMOs / CROs:Expect 2–3× more content effort per deal (for multiple stakeholders), a tightened scrutiny on ROI, and higher paid media costs. Survivors will be those who shift early into compounding trust channels (SEO, reviews, analyst relations) while maintaining precision spend in Paid Search/LinkedIn.
Author
Nate Nead
founder and CEO of Marketer
Nate Nead is the founder and CEO of Marketer, a distinguished digital marketing agency with a focus on enterprise digital consulting and strategy. For over 15 years, Nate and his team have helped service the digital marketing teams of some of the web's most well-recognized brands. As an industry veteran in all things digital, Nate has founded and grown more than a dozen local and national brands through his expertise in digital marketing. Nate and his team have worked with some of the most well-recognized brands on the Fortune 1000, scaling digital initiatives.
.png)


.svg)


