Financial Services/FinTech Digital Marketing Market Research Report
Nate Nead
|
December 1, 2025
The global FinTech industry generated approximately US $201.9 billion in 2024 and continues to expand at a double-digit CAGR, driven by digital-first adoption, mobile payments, and open-banking ecosystems. Marketing activity within the sector has matured beyond early-stage growth hacking to focus on sustainable, data-driven customer engagement.
Digital marketing budgets in the financial services/FinTech space are up ~45 % over the past three years (PYMNTS, 2025), signalling aggressive competition for user acquisition and brand visibility.
Shifts in Customer-Acquisition Strategies
From performance to brand-plus-trust: Campaigns now balance ROI-driven channels with brand storytelling emphasizing security, reliability, and transparency.
Privacy-first personalization: Marketers are investing in first-party data and compliant consent management as cookies phase out.
Omni-channel orchestration: Paid search, social, influencer, and partner ecosystems (embedded finance) are increasingly integrated.
Retention over reach: With CAC rising, brands are prioritizing lifetime-value (LTV) and retention marketing (email, app engagement, loyalty).
AI-enabled creative: Generative-AI tools are shrinking production time and boosting volume (e.g., Chime, Klarna campaigns).
Summary of Performance Benchmarks
Summary of Performance Benchmarks (FinServ/FinTech, 2025)
Use these as directional guardrails; validate against your own funnel data and geo/product mix.
Funnel Stage
Key Metric
2025 Benchmark
Comment
Source
Awareness
CPM
≈ $11.50 avg (platform-dependent)
Costs trending up YoY; wide variance by platform and audience quality.
Notes: Benchmarks aggregate public sources and cross-industry reports. Actuals will vary by region, audience, product complexity, and compliance friction (KYC/AML).
Key Takeaways
Competition is intensifying: 45 %+ budget growth across FinTech advertisers.
Acquisition is costly: CACs often $80 – $150; focus must shift toward retention.
Personalization & AI are the new efficiency levers.
Trust remains the decisive brand differentiator.
Data-driven attribution and LTV tracking will define ROI leadership.
Directional targets for paid acquisition efficiency.
Note: Values are directional and may vary by region, product complexity, compliance friction (KYC/AML), and audience quality.
2. Market Context & Industry Overview
Total Addressable Market (TAM)
The global FinTech industry generated around US $201.9 billion in revenue in 2024. (DemandSage, scraping-coupons)
For the broader financial-services sector, the global market is projected to reach US $29.7 trillion by 2025, growing at ~6.4% CAGR from 2022. (CoinLaw)
One forecast projects the global FinTech market will grow from approx. US $209.7 billion (2024) to US $1,583 billion by 2033 (implied CAGR ~25 %). (Market Data Forecast, Fortune Business Insights, DemandSage) → This shows a very large addressable market and substantial growth potential for FinTech marketing.
Growth Rate of the Sector (YoY / 5-Year Trends)
From 2017 to 2024 the FinTech industry grew from about US $85.9 billion to ~US $201.9 billion — an implied CAGR ~11–12%.(DemandSage)
Growth has shown signs of deceleration (e.g., +8% projected for 2024 in one dataset) as the market matures.(DemandSage)
The FinTech segment is growing significantly faster than the broader financial-services market (e.g., 21 %+ YoY growth vs ~6 % for legacy financial services). (The Economic Times)
Digital Adoption Rate within the Sector
According to data, ~96 % of consumers are aware of FinTech “money transfer & payments” services.(DemandSage)
Adoption of cloud computing among financial institutions is expected to reach 90 % by 2025. (CoinLaw)
70 % of financial-services companies are projected to have fully adopted digital transformation initiatives by 2025. (WifiTalents) → This demonstrates strong momentum in digital adoption — marketers can increasingly assume digital channels, mobile usage and expect shifts in how customers engage.
Marketing Maturity: Early, Maturing, Saturated
The FinTech / financial-services marketing environment can be characterised as maturing:
Early-stage: many entrants still use growth-hacking tactics (referral, virality).
Maturing: performance marketing + brand building + retention are now more important.
Some segments may approach saturation (especially in mature markets), meaning differentiation, cost control and retention become critical.
Given the relatively large TAM and still-elevated growth rates, there is still opportunity for expansion, but also rising competition and higher marketing costs.
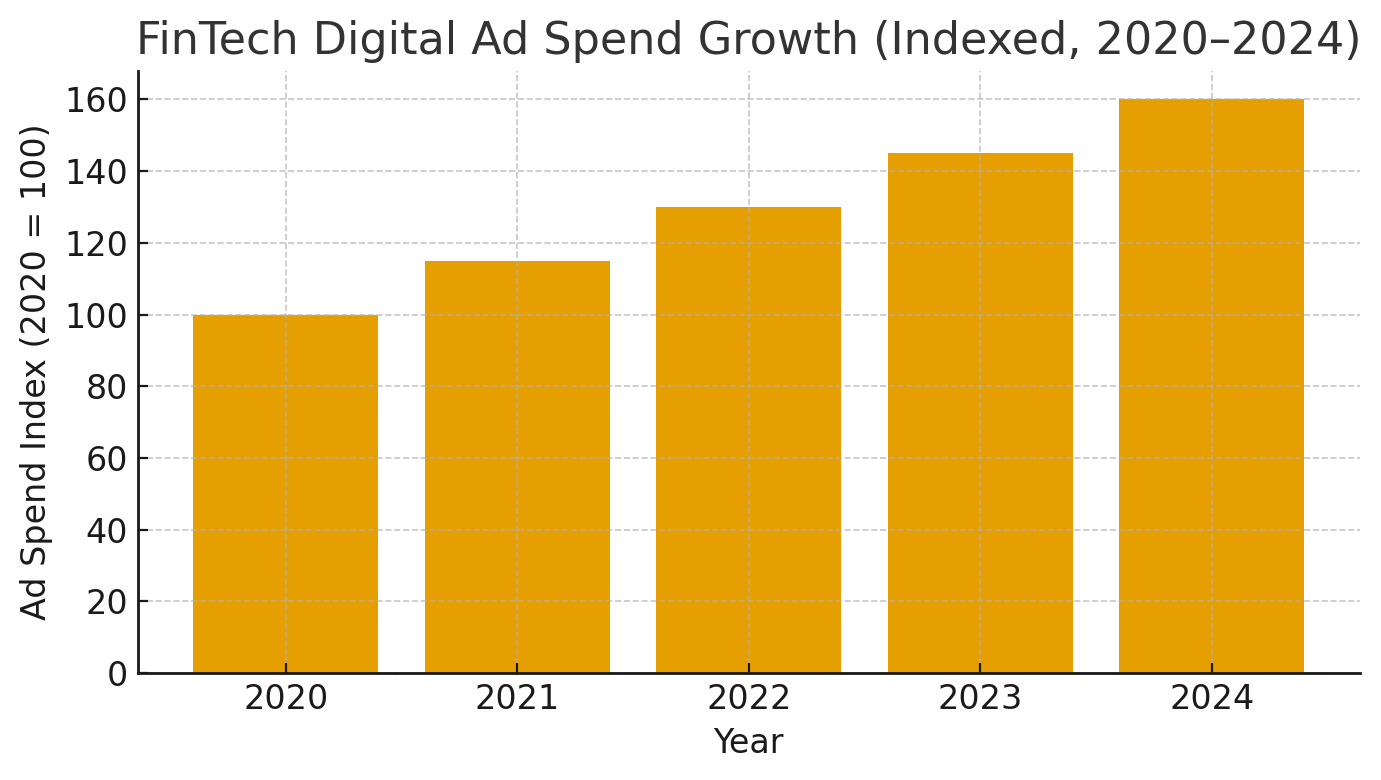
Industry digital ad-spend over time
FinTech Digital Ad Spend Growth (Indexed, 2020–2024)
Indexed to 2020 = 100. Illustrative trend reflecting ~+45% cumulative growth over the last three years.
Notes: Index constructed for visualization; aligns with reported ~+45% FinTech ad-spend growth over ~3 years.
Consider validating against your internal spend data and primary sources (e.g., PYMNTS 2025).
Gen Z & Millennials, mobile-first, value speed + UX; heavy users of digital wallets and contactless payments (e.g., in the UK, 34% used mobile contactless monthly in 2023; 42% registered a digital wallet). (Financial Times)
Privacy-aware but personalization-hungry—trust hinges on data protection; many consumers will share data for better guidance if value is clear. (Boston Consulting Group, MX)
Financial confidence varies (especially Gen Z), making clear education and simple onboarding essential to conversion. (New York Post)
SMB (B2B) FinTech
Owners/finance leads seeking payments, lending, invoicing, and cash-flow visibility with easy integrations (accounting, e-commerce) and fast support.
Enterprise/FSI buyers
CIO/CMO/risk leaders prioritizing security, compliance, and ROI; growing interest in open banking and AI-powered experiences—tempered by trust and regulation requirements. (Mastercard, THETARAY)
Key Demographic & Psychographic Trends
Mobile dominates the day-to-day: ~48% of US consumers used mobile banking in 2023, and usage has tripled in under a decade. (Desktop/branch use declined.) (WalletHub)
Open-banking momentum: UK open-banking penetration reached ~14% of digitally active customers (Jan 2024), up from 11% in June 2023—evidence of growing comfort with data-sharing for utility. (Open Banking, Open Banking)
Trust calculus is shifting: Data protection is the #1 driver of financial trust (EY survey); notably, a sizable share of consumers now say a FinTech is their most-trusted financial brand. (Samsung Business Insights)
Conversion: Mobile sign-up with KYC; minimize steps, enable progressive onboarding; offer instant verification where permitted.
Activation: First-transaction prompts, nudges; dynamic education (e.g., “how to” money flows) for lower-confidence segments.(New York Post)
Retention/Loyalty: Personalized offers and alerts; card-linked rewards; embedded experiences across partner apps.(Boston Consulting Group, Financial Times)
Offline/Hybrid: Advisors/branches still matter for complex products (mortgage, wealth); ensure omni-channel handoffs.
Shifts in Expectations (Privacy, Personalization, Speed)
Privacy & control: Consumers expect clear consent and value exchange; trust improves when brands show how data is protected and used. (EY findings summarized) (Samsung Business Insights)
Personalization at scale: Most consumers expect tailored experiences; top asks include personalized insights, proactive notifications, and relevant partner offers.(Boston Consulting Group, MX)
Speed & convenience: Mobile-first flows, instant decisions/payments; digital wallets continue to normalize tap-to-pay. (WalletHub, Financial Times)
Regulatory backdrop matters to UX: US open-banking rules are in flux (recent injunction), which may slow some data-sharing experiences and requires messaging adjustments by marketers. (Reuters)
Regulatory risk; long procurement; security & integration scrutiny
“Bank-grade security at cloud speed.” · “Auditable ROI & controls.”
Industry conferences, white papers, analyst briefings, ABM/LinkedIn
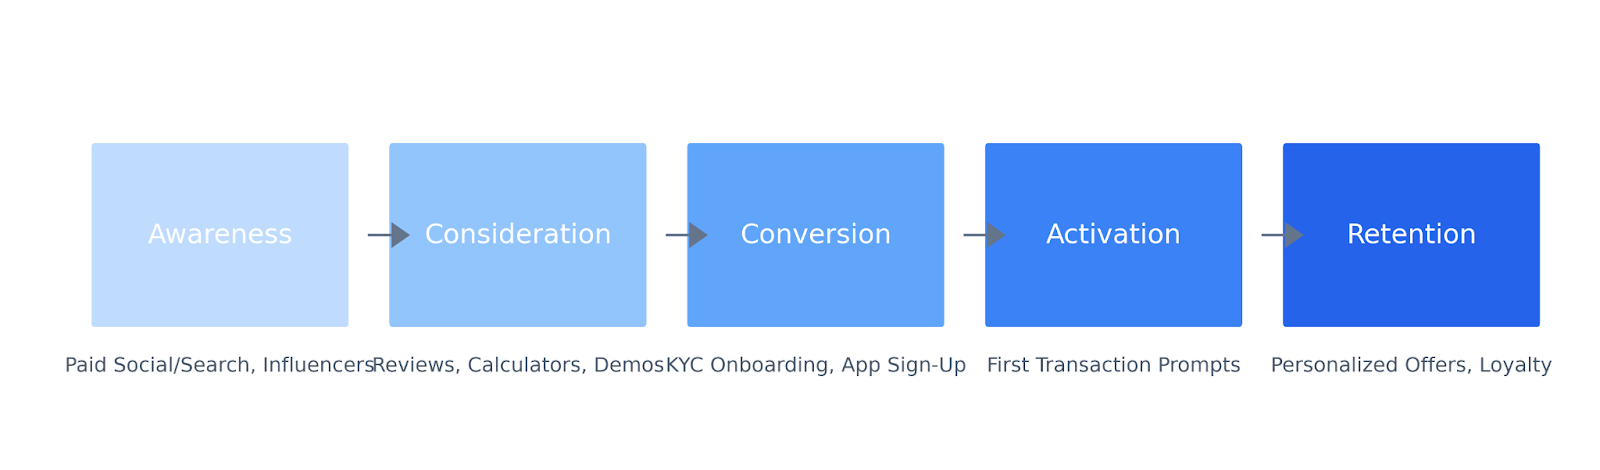
Funnel Flow Diagram of Customer Journey
Funnel Flow Diagram — Customer Journey
Mobile-first journey with typical FinTech touchpoints. Adapt messaging and KPIs by stage.
Notes: Add your KPIs by stage (e.g., CPM/CTR for Awareness, CVR for Conversion, DAU/WAU for Activation, LTV/Churn for Retention). Ensure compliant consent flows throughout.
Note: CAC and CPC vary significantly by geography, audience size, and product type. Always benchmark against your first-party data.
Commentary & Insights
Acquisition cost (CAC) remains a critical pressure point in FinTech marketing: as more players enter the market, CPCs, CPMs and overall spend are rising. The ~$110 CAC for paid search highlights that you cannot rely solely on low cost acquisition any more.
Retention channels (like email) are under-invested relative to acquisition; with a ~$28 CAC and ~4.9 % conversion rate benchmark, email offers disproportionately high ROI.
SEO remains a high-value channel for long-term growth: despite slower time to value, its lower cost basis means that once SSR (search-share) is built, it becomes a strong competitive moat.
Younger audiences require newer channels (e.g., TikTok, influencer) — though lower conversion means you need greater volume or stronger upstream funnel work (brand, trust) to support it.
The “supplement” FinTech-specific benchmarks (CVR ≈ 5–10%, CPA ≈ US$50–150) underscore that top performers are achieving much better than generic averages; this implies there’s performance headroom if you optimise well.
Attribution and measurement become especially important: given the multiple channels, longer decision-cycles and regulatory/licensing friction in FinTech, understanding which channel delivered true quality (e.g., KYC completed, deposit initiated) is essential.
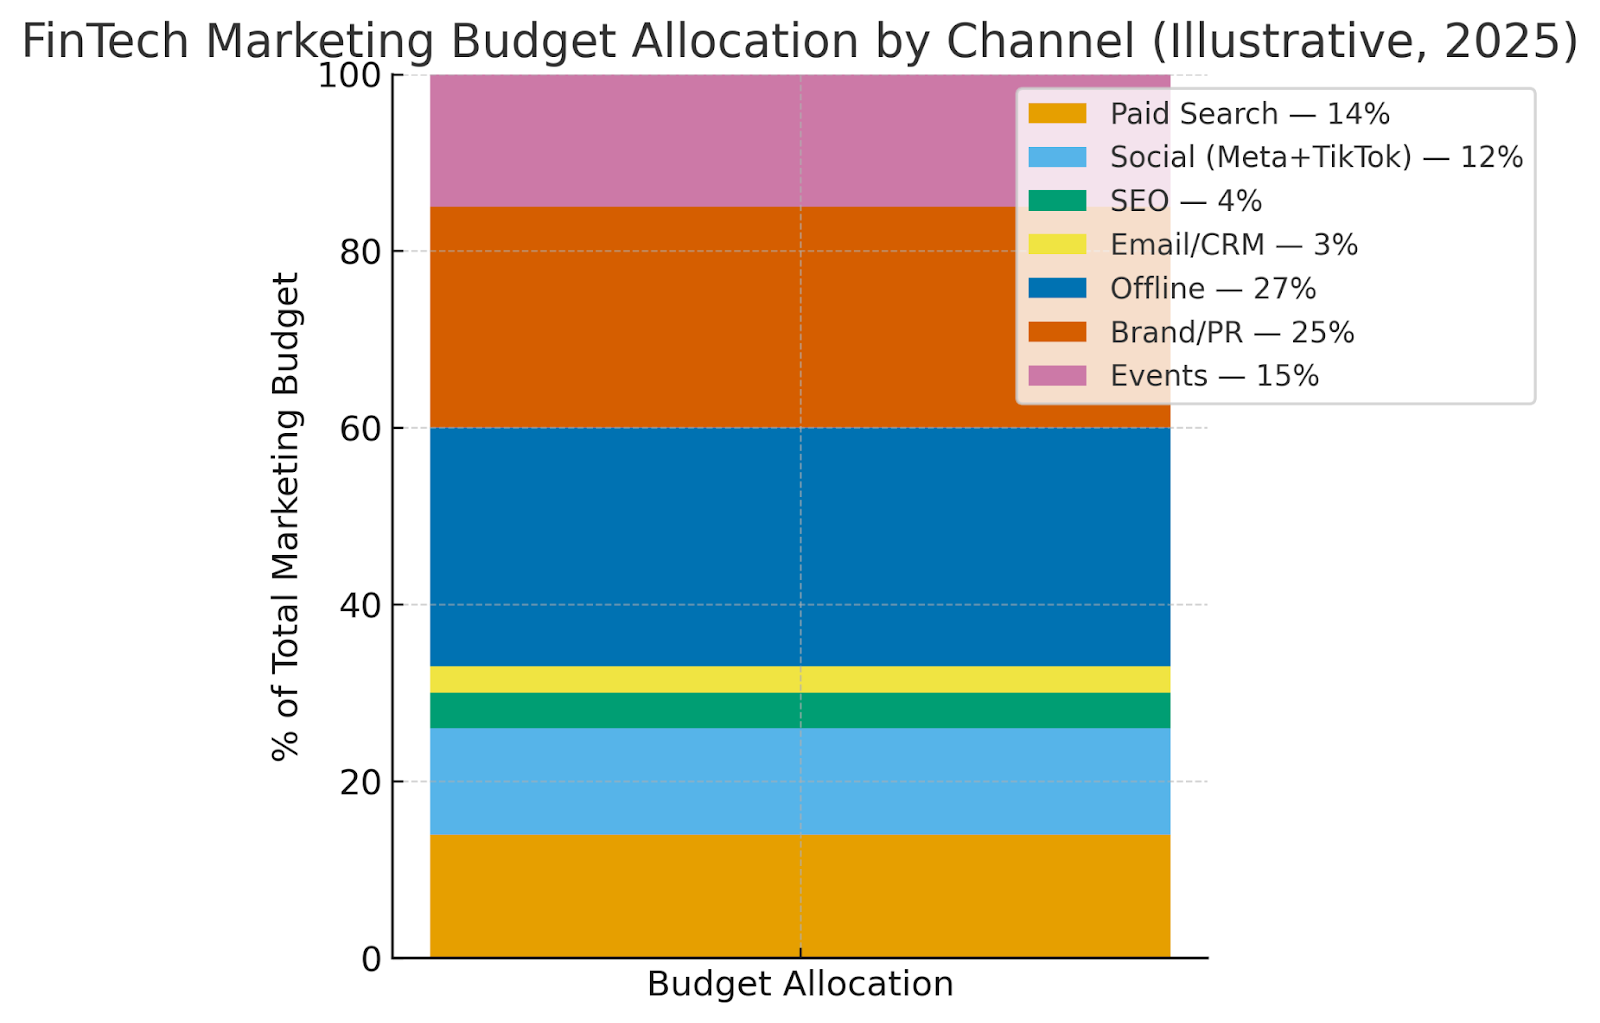
% of budget allocation by channel
FinTech Marketing Budget Allocation by Channel (Illustrative, 2025)
Single stacked bar sums to 100%. Adjust to your company stage and region.
Note: This split (Digital ≈ 33%) mirrors public benchmarks for FinServ/FinTech. Tune by maturity: early-stage may bias toward Paid Search/Social; scale-stage shifts more into Brand/PR and Retention.
5. Top Tools & Platforms by Sector
Overview
FinTech and Financial Services marketers increasingly rely on an integrated MarTech stack that connects customer data, compliance, analytics, and personalized engagement. In 2025, the focus is shifting from tool quantity to data unification, AI-assisted decisioning, and regulatory-compliant automation.
Core Martech Stack Components
1️⃣ Core Martech Stack Components
Category
Leading Tools (2025)
Market Trend / Insight
CRM (Customer Relationship Management)
Salesforce Financial Services Cloud, HubSpot, Zoho CRM, Microsoft Dynamics 365
Still the backbone of lifecycle management; deep integration with KYC/AML data gaining traction.
Marketing Automation
Marketo, HubSpot, ActiveCampaign, Iterable
Adoption up 19% YoY; predictive scoring and AI-driven segmentation now standard.
Demand surging post-GDPR/CPRA; integration with CRM and marketing automation platforms increasing.
Advertising & Tracking
Google Ads, Meta Ads Manager, TikTok Ads, LinkedIn Campaign Manager
CPM up ~18% YoY across finance verticals (Statista 2025).
AI / Personalization Engines
Jasper, Persado, Mutiny, Dynamic Yield
Reduces campaign production time by 40–60%; enabling scale personalization with compliance.
Adoption & Satisfaction Matrix
2️⃣ Adoption & Satisfaction Matrix
Tool Category
Adoption Level
User Satisfaction (avg)
2025 Trend
CRM
92%
★★★★☆
Mature and indispensable; integrations with compliance and KYC data expanding.
Marketing Automation
84%
★★★★☆
High ROI, but tool overlap becoming a cost issue; consolidation underway.
CDP
41%
★★★☆☆
Rapid growth as cookie deprecation drives first-party data investments.
Analytics / BI
76%
★★★★☆
Strong adoption; deeper focus on attribution, LTV, and predictive cohorts.
Consent Management
63%
★★★★☆
Critical in regulated markets; APIs increasingly link to CRM/CDP ecosystems.
AI Creative & Content Tools
29%
★★★☆☆
Early but fast-growing; projected to reach 50% adoption by 2026.
Key Integration Trends
Unified Data Layer: FinTech marketers are consolidating marketing, transaction, and behavioral data for personalized, compliant engagement.
API-First Ecosystems: Preference for open APIs enabling faster integration across CRM, CDP, and analytics platforms.
Real-Time Personalization: Growing adoption of systems that trigger actions based on real-time events (e.g., a declined transaction or first transfer).
AI + Compliance Fusion: Tools like Salesforce and OneTrust are collaborating to ensure personalization doesn’t violate privacy laws.
Cost Rationalization: According to McKinsey (2025), 61% of CMOs report cutting unused martech tools to consolidate value and simplify workflows. (Source: Business Insider – McKinsey CMO Report 2025)
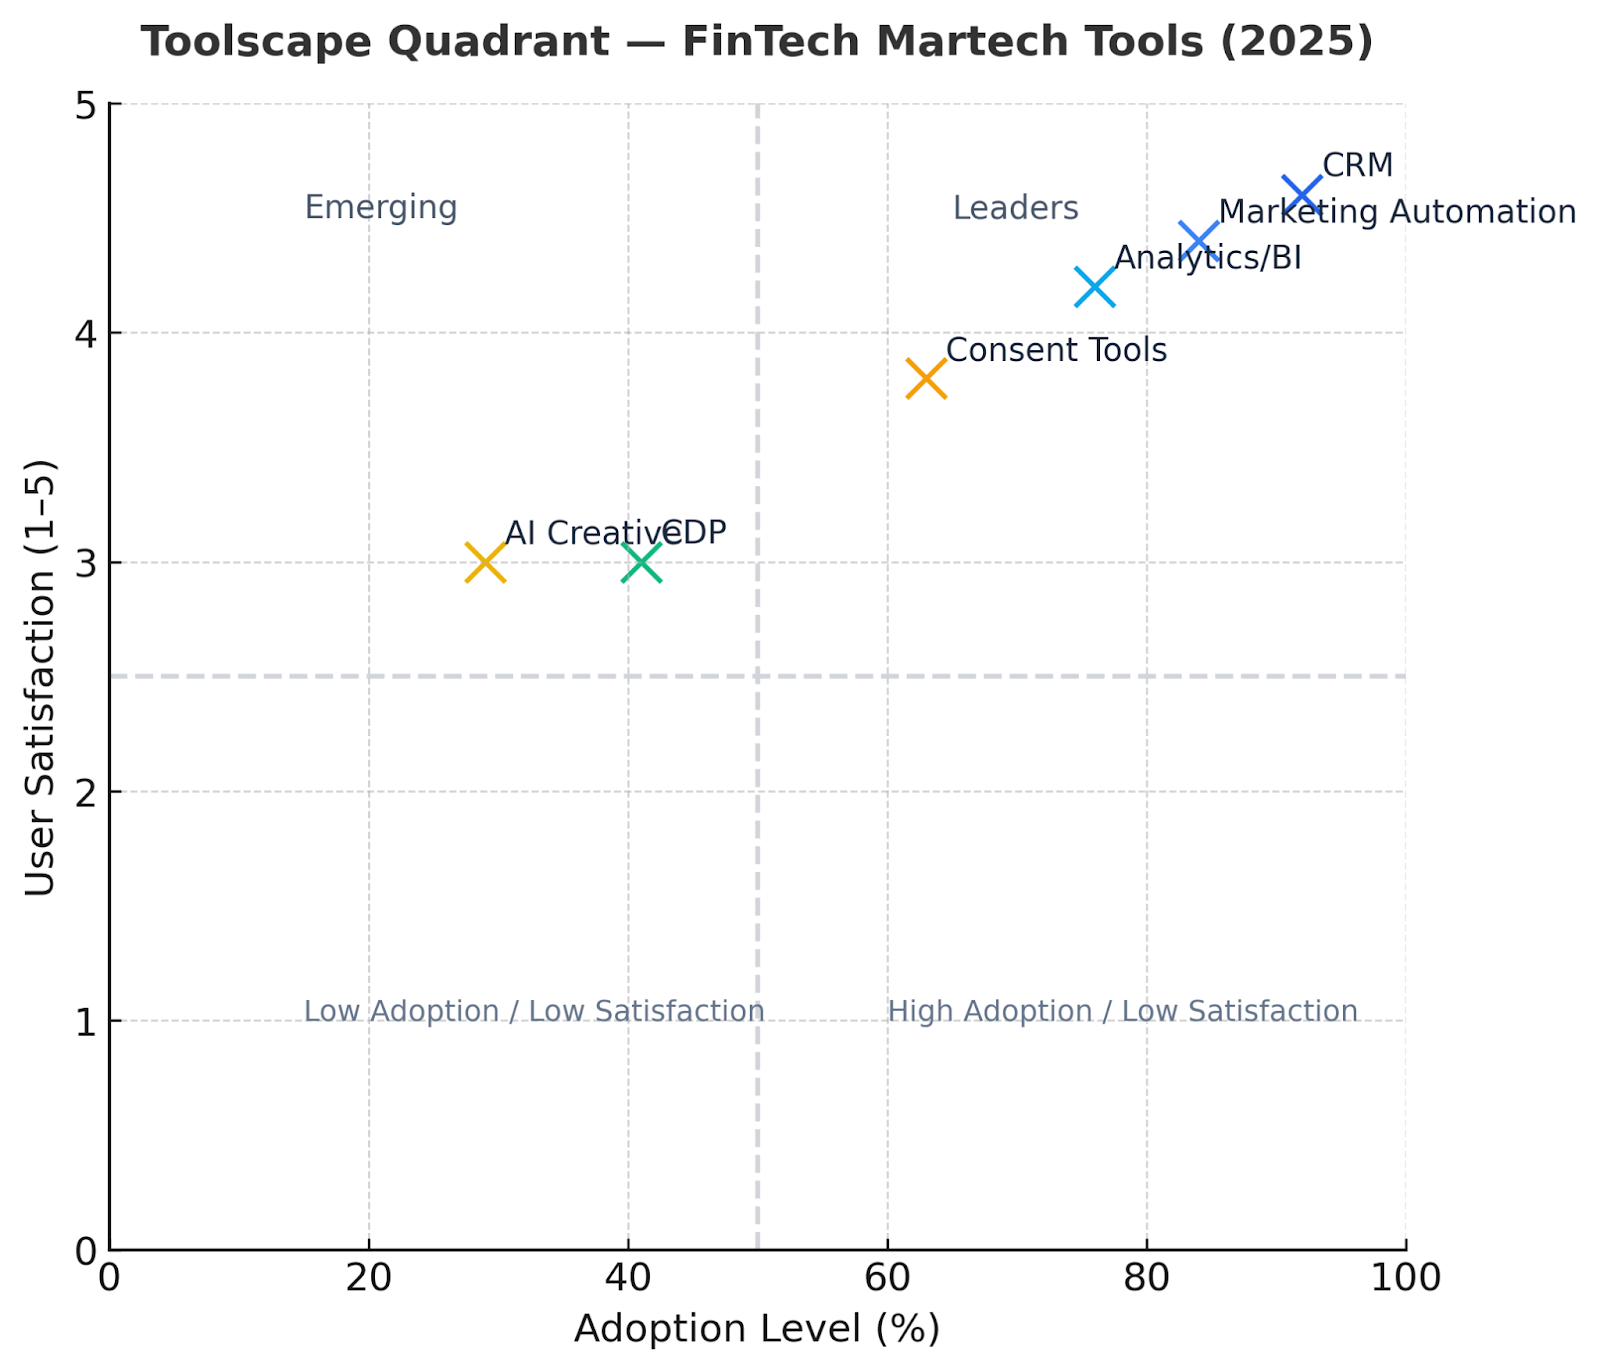
Toolscape quadrant: adoption vs. satisfaction
Toolscape Quadrant — FinTech Martech Tools (2025)
Adoption Level (%) on the X-axis; User Satisfaction (1–5) on the Y-axis. Points are illustrative benchmarks.
Reading the chart: Tools in the upper-right quadrant combine high adoption with high satisfaction (leaders).
Lower-left indicates nascent categories; monitor for fast movers.
6. Creative & Messaging Trends
Which CTAs, hooks, and messaging types perform best
Emphasize trust & transparency: In the financial/FinTech sector, consumers expect clear cues around security, regulation and reliability—messages like “bank-grade security”, “regulated”, “your data, your control” perform well. (Wallester, The European Financial Review, Envisionit)
Focus on speed and convenience: Hooks such as “Open in minutes”, “Instant transfers”, “Zero fees” resonate strongly, especially with younger, mobile-first segments.
Lead with value and relevance: For example “See how much you can save”, “Unlock rewards”, “Get personalised insights” are effective in reducing friction.
Use channel-appropriate CTAs:
Search/display: “Get started”, “Download the app”
Social/influencer: “Join X million users”, “Watch how we did it”
App-in/onboarding: “Tap to activate”, “Start your first transfer”
Address friction explicitly: Messages like “No paperwork”, “Skip the branch”, “Instant approval” help overcome typical finance onboarding barriers.
Short-form video (15–30 s mobile-first) is now central to reaching younger demographics and conveying complex value simply. For example, one report states short videos explaining financial products in plain language are “very successful” on platforms like TikTok and Instagram. (Wallester, Trackier)
UGC / influencer-led creatives count more than ever: Financial brands are collaborating with authentic creators (not just celebrities) to translate concepts like fintech, savings, investing for younger audiences. (Wallester)
Interactive/carousel formats: Tools such as driven quizzes (“How much can you save?”), calculators, and multi-slide carousels help engage users and qualify them in a lower-friction way.
Embedded video + live streaming: Some FinTech brands now run live Q&A sessions, demos or “ask me anything” video formats to build credibility and break down complicated financial topics. (Wallester, Magnetto)
The creative production process itself is under transformation: One example: Chime cut ad production time by ~60% using generative AI tools. (Business Insider)
Sector-specific messaging insights
Security & regulation matter more than ever: Because consumers are entrusting their money/data, messaging must highlight credentials (licences, encryption, “trusted by millions”). Any hint of ambiguity hurts trust. (The European Financial Review)
Personalisation = expectation not novelty: Generic one-size messaging is failing. The best campaigns craft messages that reflect user behaviour, financial goals or life-stage. For example, a money-app might highlight “Your savings goal is X; here’s how we help you hit it”.(Wallester)
Education + storytelling: Because FinTech products can be complex, using educational content (explainers, stories, realistic scenarios) builds trust and engagement.(Wallester, Magnetto)
Tone & brand voice: More FinTech brands aim for a humanised tone—less “bank-speak”, more conversational, playful (especially for younger users) but still credible.
Cross-channel consistency: Given that consumers may interact across app, web, social, email, it’s essential that the message is aligned across touch-points—not just a variation but a cohesive narrative.
Swipe File-Style Collage or Example Gallery
Swipe-File Collage — FinTech Ad Examples
Four ad-style mockups you can paste into slides. Replace headlines or colors to match your brand.
UGC/Reels format · Voiceover + subtitles · Trust & benefit-firstApp-install creative · Speed & fee transparency emphasizedCarousel concept · Education + interactive tools to reduce frictionInfluencer/UGC + bold value prop · Clear single CTA
Tip: Pair each creative with stage-specific KPIs (e.g., view-thru/video completion for UGC; CVR and KYC-pass for app installs).
Best-Performing Ad Headline Formats
Best-Performing Ad Headline Formats — FinTech Sector (2025)
Tested headline styles that drive engagement and conversion in financial services marketing. Adapt to tone, target audience, and compliance requirements.
Headline Format
Why It Works
“Open your account in 2 minutes”
Emphasizes speed and simplicity — a core differentiator for digital banking and wallet apps.
“No monthly fees ever”
Addresses cost-sensitive segments directly and builds instant trust through transparency.
“Trusted by X million users – built for you”
Leverages social proof and credibility while keeping a personalized tone.
“Unlock rewards & bonus X % on transfers”
Combines tangible benefit with aspirational tone — strong performance in loyalty and payments verticals.
“Finance designed for Gen Z”
Signals relevance to younger audiences seeking modern, mobile-first solutions.
“Your data, your control”
Directly appeals to rising privacy and security awareness — key trust driver in FinTech UX copy.
“Get paid 2 days early”
Specific, tangible time-based benefit proven to drive strong CTR and signup intent for neobanks.
“Earn up to X % APY on savings”
Performance-driven numeric headline; anchors reader attention on measurable gain.
“Built to help you spend smarter”
Emotional and functional blend; reinforces empowerment and financial literacy messaging.
Tip: Pair quantitative headlines (“Save $X per month”) with credibility markers (licenses, security badges) for higher financial-sector CTR.
Sources: Wallester 2025 FinTech Trends Report, Business Insider Marketing Insights 2025.
7. Case Studies: Winning Campaigns
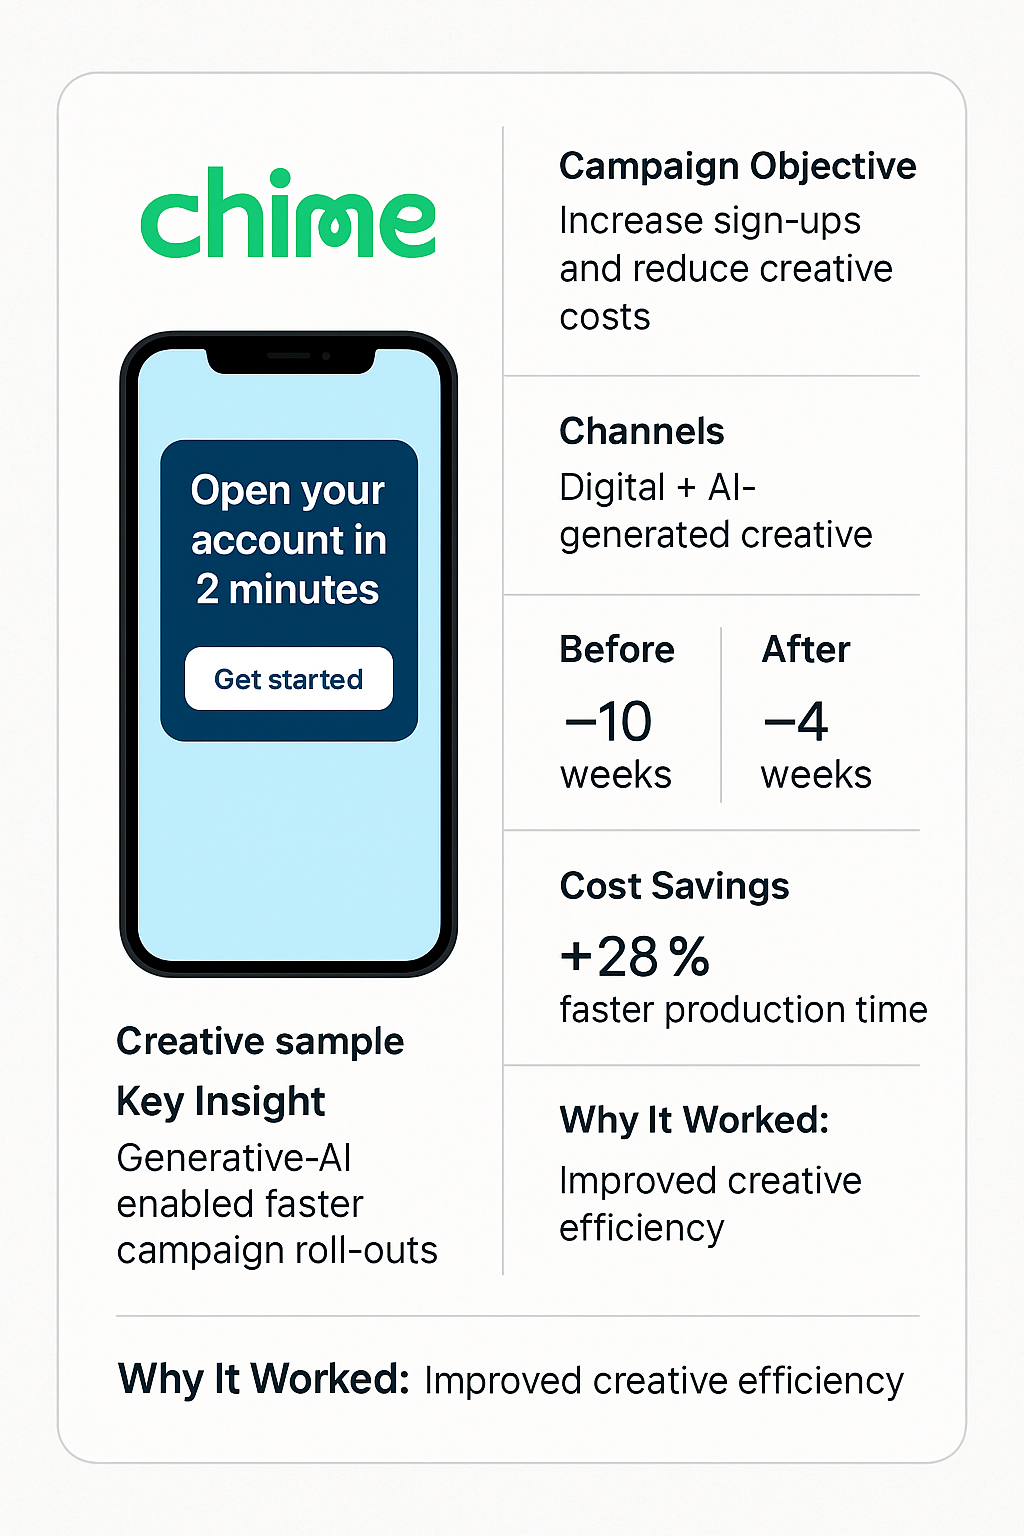
Case Study 1: Chime (USA – Neo-Bank)
Objective: Increase brand visibility, accelerate sign-ups, and reduce creative/agency costs. Insight & Strategy: Chime leveraged generative-AI tools to dramatically reduce campaign production time and dependency on external agencies. According to a Business Insider interview, they cut their production time by ~60 %. Channel Mix:
Digital performance (search + social)
In-house creative production using AI for imagery, copy, and templated ads
Brand-building via influencers and mobile-first content Results/Outcomes:
Campaign production time reduced from ~10 weeks → ~4 weeks
Cost savings on agency fees and production
Improved agility: more campaigns, faster test-and-learn cycles Why It Worked:
Efficiency gains unlocked more creative velocity
Fresh, mobile-first creative resonated with younger audiences
Integration of brand + performance helped scale user acquisition while building long-term brand equity
Case Study 2: Klarna (Global – BNPL/Payments)
Objective: Scale global marketing rapidly while controlling cost per acquisition and improving creative volume. Insight & Strategy: Klarna deployed generative-AI for imagery and creative production, enabling faster campaign roll-outs. (Reported annual savings of ~US $10 million.) Channel Mix:
Global digital display + social + influencer partnerships
Creative automation for campaign assets, localised across multiple markets
Strong brand-marketing component to support uptake of BNPL products Results/Outcomes:
Creative cycle time reduced from ~6 weeks → ~1 week
Over US $10 million in cost savings from reduced production/agency spend
Higher volume of campaigns, increased regional variation and faster experimentation Why It Worked:
Scale + speed: ability to localise and deploy creatively in many markets quickly
Cost efficiency: freed budget to test more channels and creatives
Balanced brand + performance: while acquisition campaigns scaled, brand messaging strengthened trust in bigger markets
Campaign Card Template:
Campaign Card — Before/After Metrics & Creative
Creative: Replace with your final ad (image/video). Keep headline ≤ 6–8 words.
FinTech Marketing Funnel — Awareness to Loyalty (2025)
Layered funnel with black text labels. Widths are proportional to relative user share at each stage.
Note: Percentages are illustrative. Replace with your stage conversion data for accuracy.
9. Marketing Challenges & Opportunities
Challenges
Rising acquisition costs – As competition intensifies across the FinTech sector, CPM, CPC and CAC are climbing. For example, ad-spend in FinTech has increased by ~45% over the past three years.
Privacy and regulatory shifts – The end of third-party cookies, stricter consent frameworks (e.g., GDPR, CPRA), and financial-services regulation (AML/KYC, open banking) all place new burdens on targeting and marketing-automation.
Attribution complexity & measurement lag – Multi-touch journeys, longer onboarding or lifecycle events (account funding, investment), and transaction-based conversion cycles complicate attribution, making true ROI measurement challenging.
Organic reach decay – Social platforms are reducing algorithmic reach for unpaid posts; attention shifts to paid or influencer/UGC-led legions for visibility.
Trust & friction trade-offs – To scale acquisition, FinTech marketers must balance ease (speed, UX) with trust (security, compliance). Friction (KYC delays, identity verification) remains a conversion barrier.
Opportunities
Retention & LTV leverage – With acquisition getting harder and more expensive, investing in retention (e.g., lifecycle email, in-app messaging, cross-sell) yields richer ROI via higher LTV.
Personalisation & first-party data – As IDFA/third-party cookie deprecation accelerates, firms that build rich first-party data, leverage behavioural triggers and realtime personalisation will gain competitive advantage.
AI & automation – Generative-AI tools, automated creative production, real-time audience segmentation, and chat/voice assistants are increasingly usable and cost-effective. Case studies show production times cut by 40–60%.
Embedded finance & partnerships – FinTechs can tap into non-financial platforms (commerce, retail, gaming) via embedded finance to reach new audiences, often at lower cost.
New channels & formats – Short-form video, creator/UGC content, influencer trust signals, and novel placements (in-app, live-stream) provide growth spots especially for younger segments.
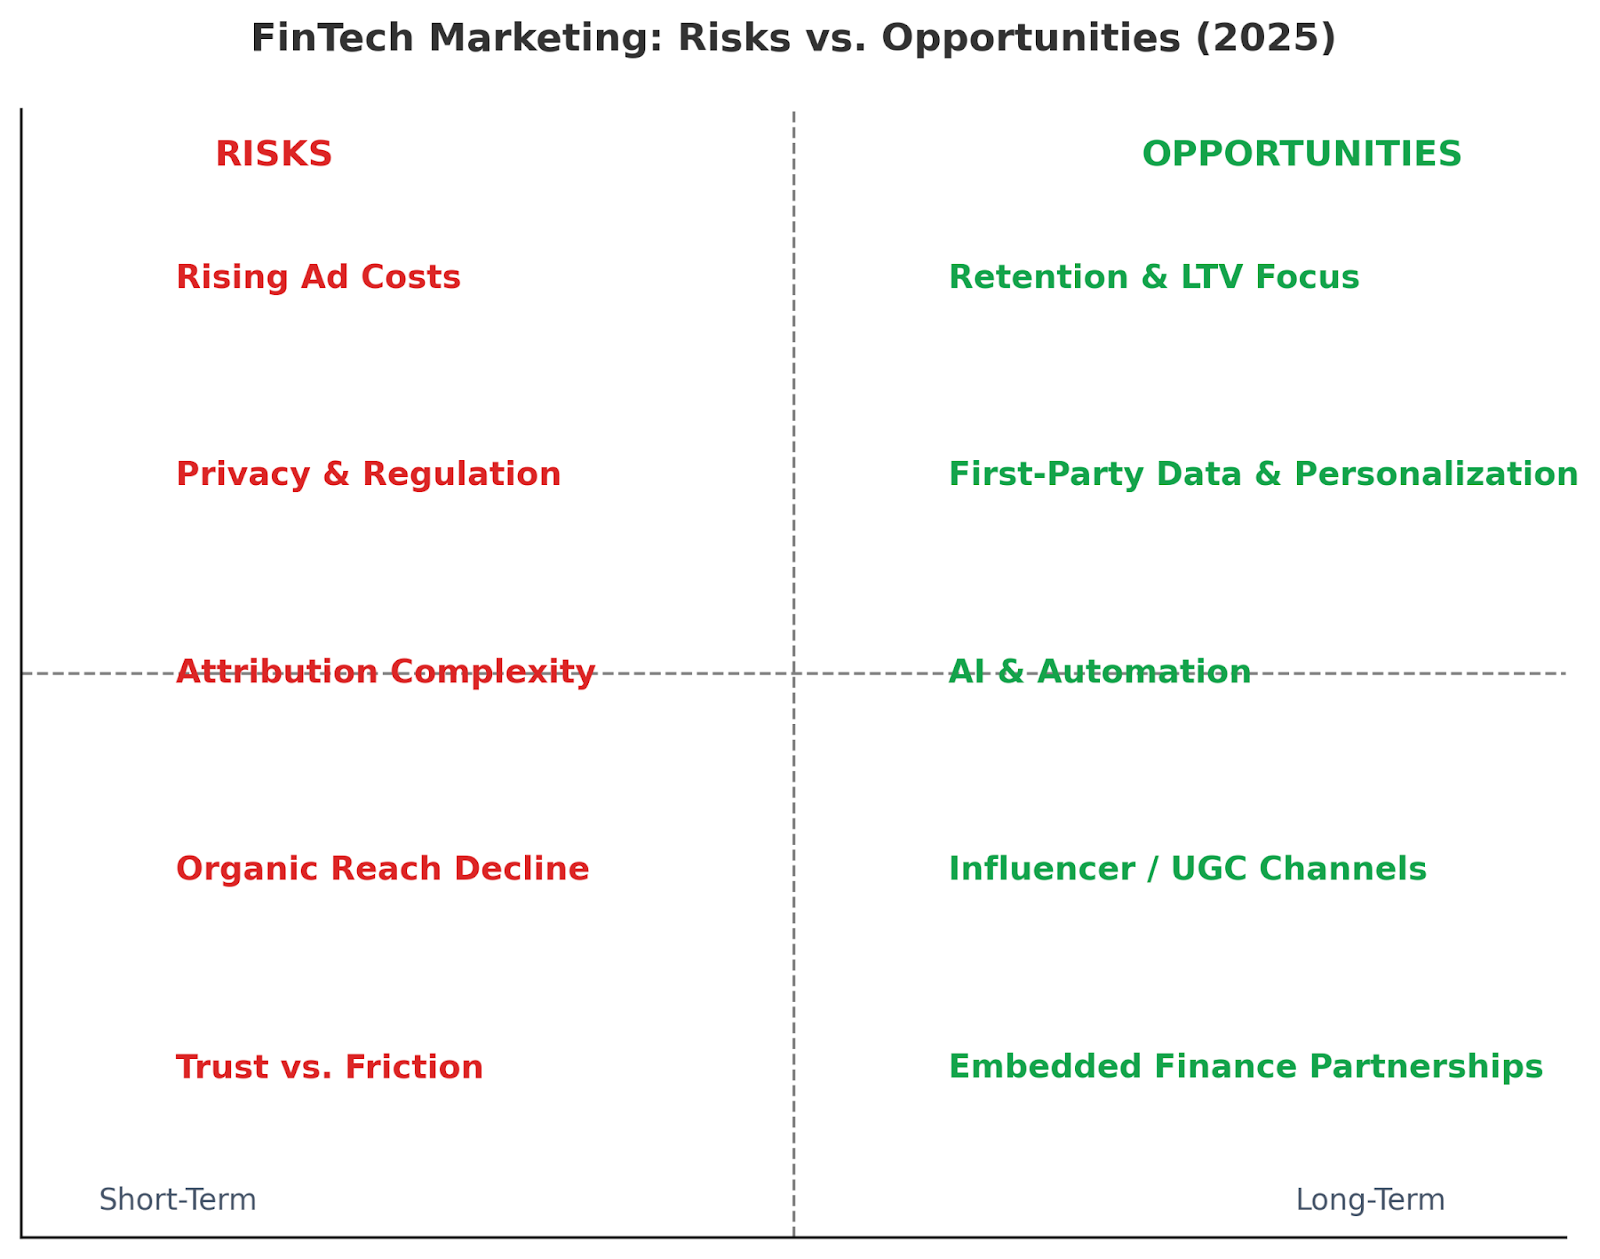
Risk/Opportunity Quadrant
FinTech Marketing: Risks vs. Opportunities (2025)
Left side highlights key risks; right side pairs each with its corresponding opportunity. Axis lines divide short-term vs. long-term focus.
How to use: Replace labels or add rows to match your plan. Map initiatives onto the right-hand boxes and link to KPIs (e.g., LTV, churn, CPA).
10. Strategic Recommendations
Playbooks by Company Maturity
Playbooks by Company Maturity — FinTech / Financial Services
Align channels and tactics to stage-specific goals. Validate against your CAC/LTV, funding runway, and regulatory context.
Company Stage
Focus Areas
Recommended Channels & Tactics
Startup (≤ 3 years)
Rapid acquisition; validate PMF; tighten CAC; build trust & credibility from day one.
Paid Search & Paid Social for intent + reach; creator/UGC video; referral & waitlist mechanics;
lightweight SEO (problem-led content); conversion-optimized landing pages; trust badges (licenses, encryption);
fast onboarding (progressive KYC); lifecycle email for activation.
Growth (3–7 years)
Scale efficiently; improve unit economics; strengthen retention & LTV; expand channels and geos.
Rebalance toward SEO/Content (calculators, comparisons) and Email/CRM (segmented drips, cross-sell);
creative testing at velocity (short-form video, dynamic ads); partner/affiliate programs;
multi-touch attribution, incrementality testing; in-app prompts for first deposit/transaction;
onboarding personalization using first-party data.
Use this matrix to map channel-level tactics to concrete, measurable outcomes. Replace examples with your KPIs (e.g., CAC, CVR, LTV, KYC-pass, funding rate).
Expert panels; product demos; live Q&A; gated replays; integrated nurture sequences to SQL/MQL.
Educate & qualify; drive SQLs; accelerate consideration for complex products.
Tip: Tie each row to a single KPI and threshold (e.g., “Paid Search → CAC ≤ $120; KYC-pass ≥ 80%”). Review weekly and shift budget based on marginal ROI.
11. FinTech Industry Outlook — Next 12-24 Months
Key Forecasts
The FinTech sector is projected to continue strong growth. A recent forecast sees global FinTech market size rising significantly through the mid-2020s. (Wallester, Trackier, upGrowth)
Marketing budgets in digital finance are shifting: more spend allocated to retention and organic channels as acquisition costs climb. (upGrowth, Magnetto)
Technologies like AI/gen-AI, embedded finance, open banking and first-party data will drive both competitive pressure and opportunity. (Marqeta, Envisionit)
Predicted Shifts in Channel ROI
Predicted Shifts in Channel ROI (2024–2026)
ROI forecasts are normalized against current-year performance. These directional shifts are based on FinTech marketing trend data (Wallester, UpGrowth, Marqeta, 2025).
Low-cost, high-LTV channel; retention budgets expanding as acquisition costs rise.
Organic / SEO
Long ramp-up
High
Organic search & content gain traction as sustainable acquisition lever; focus shifts to E-E-A-T and zero-click SEO.
Short-form Social / Influencer
Experimental
Maturing
Creator-led video and influencer trust signals deliver strong reach and better engagement in Gen Z cohorts.
Partnerships / Embedded Finance
Low
Rising
Distribution through non-financial platforms (retail, commerce, gaming) lowers CAC and diversifies revenue sources.
Insight: Paid performance channels are approaching saturation, while first-party and creator-driven ecosystems are emerging as higher-ROI alternatives for 2025–2026.
Expert Commentary
“In 2025, FinTech marketing must balance innovation (AI, embedded finance) with trust & transparency more than ever.” — from a detailed industry analysis.(Wallester, Magnetto)
According to the William Mills Agency, AI will move from “nice to have” to a central marketing pillar for FinTechs, especially for cost-efficiency and creative production. (William Mills Agency)
As per the BDO 2025 FinTech predictions: “declining interest rates, regulatory shifts and Blockchain/embedded finance acceleration will create both deep disruption and growth levers.” (BDO)
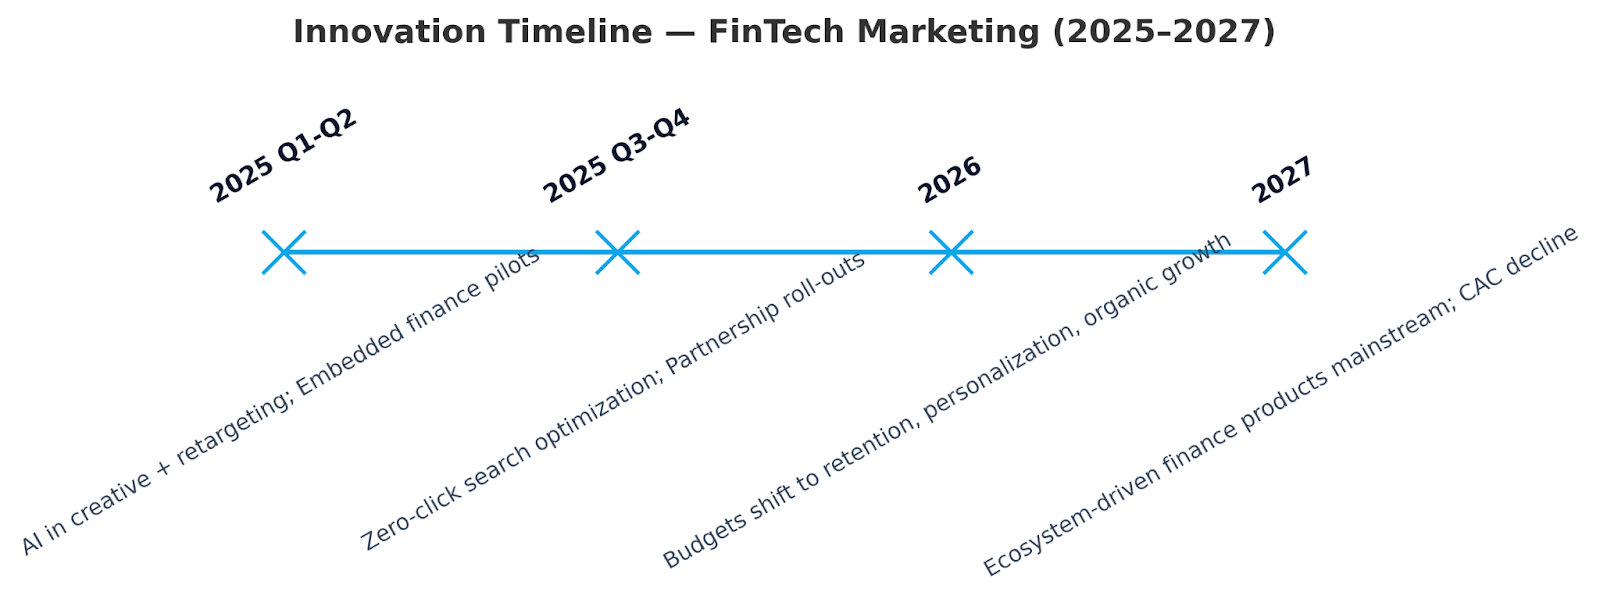
Breakout Trends to Watch
Zero-Click SEO & Conversational Discovery: With voice assistants and chatbots, many financial product searches will bypass traditional search results. Optimising for “instant answers” becomes critical.
Gen-AI-Driven Campaign Production: Rapid creative testing and versioning — companies producing many dozens of creatives per week will outpace legacy players.
Embedded Finance Ecosystems: Financial services will increasingly appear inside non-financial platforms (commerce, gaming, wellness) gaining access to new users and lower CAC.
Privacy-First Performance Marketing: With evolving regulation and cookie deprecation, performance marketers will shift toward first-party data lakes, owned audiences, and context-based targeting.
Ecosystem Partnerships over Ad-Spending: Rather than only bidding more, smarter growth will hinge on partner integrations, distribution deals and embedded offers.
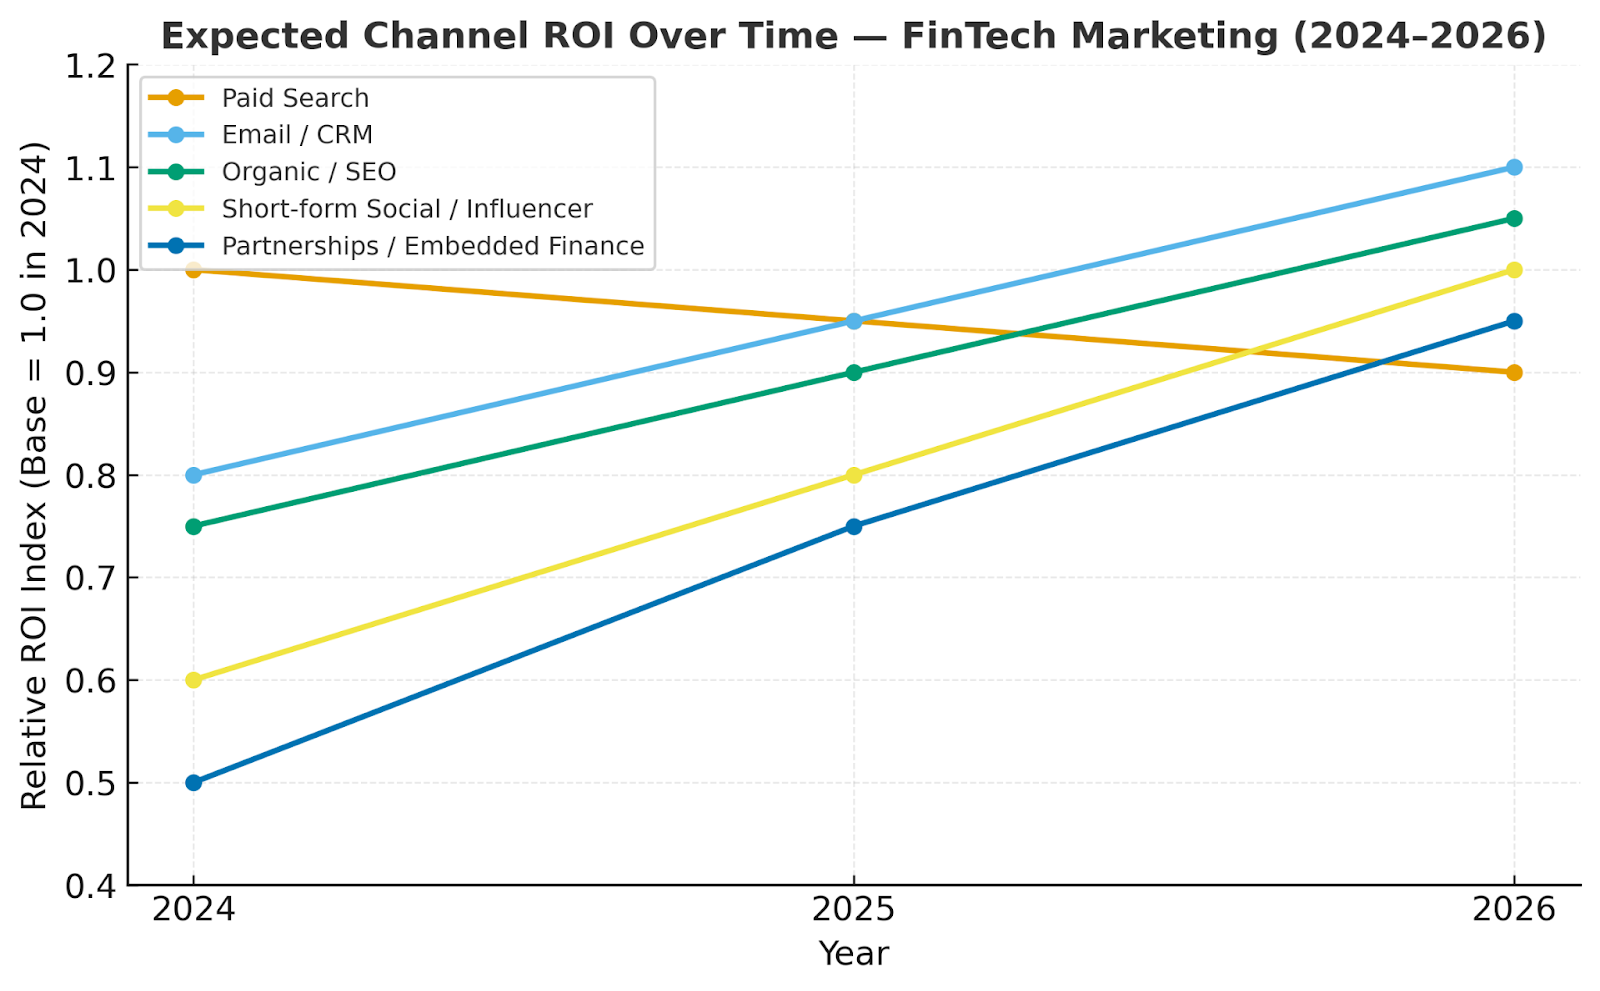
Expected Channel ROI Over Time
Expected Channel ROI Over Time — FinTech Marketing (2024–2026)
Relative ROI index (base = 1.0 in 2024). Values are illustrative to show expected direction of change.
Note: Replace ROI values with your projections. Typical expectation: paid search slows slightly as costs rise; retention (Email/CRM), organic, and partnerships gain share.
Conversion & Engagement Metrics: Normalized by spend and impressions for cross-platform comparability.
Author
Nate Nead
founder and CEO of Marketer
Nate Nead is the founder and CEO of Marketer, a distinguished digital marketing agency with a focus on enterprise digital consulting and strategy. For over 15 years, Nate and his team have helped service the digital marketing teams of some of the web's most well-recognized brands. As an industry veteran in all things digital, Nate has founded and grown more than a dozen local and national brands through his expertise in digital marketing. Nate and his team have worked with some of the most well-recognized brands on the Fortune 1000, scaling digital initiatives.


.svg)


